
Blog

  • Generate Street Lamps With Blender Python API For Website

    Generate Street Lamps With Blender Python API For Website

    Creating a Street Lamp Model in Blender with Python and Displaying it on the Web with Model Viewer

    Welcome to this beginner friendly tutorial on how to generate a simple street lamp model using Blender’s Python API and display it in your web browser. We will walk through the process step by step including creating the model preparing the environment for web display and understanding the best formats for browser support.

    Generating the Street Lamp with Blender Python API

    First we will use Blender’s Python scripting capabilities to create a basic street lamp model. Here is a sample script that generates a street lamp with a chrome color and animated lights:


    import bpy
    import bmesh
    from mathutils import Matrix
    import os 
    import sys
    
    # --- 1. Scene Setup and Cleanup ---
    bpy.ops.wm.read_factory_settings(use_empty=True)
    
    # --- 2. Geometry Creation Helpers (Unchanged) ---
    
    def create_cylinder_mesh(name, radius, depth, location):
        """Creates a cylinder using bmesh for robustness."""
        bm = bmesh.new()
        bmesh.ops.create_cone(
            bm, cap_ends=True, segments=32, radius1=radius, depth=depth,
            matrix=Matrix.Identity(4)
        )
        translation_matrix = Matrix.Translation((location[0], location[1], location[2]))
        bmesh.ops.transform(bm, verts=bm.verts, matrix=translation_matrix)
        
        mesh_data = bpy.data.meshes.new(name + "_Mesh")
        bm.to_mesh(mesh_data)
        bm.free()
        
        obj = bpy.data.objects.new(name, mesh_data)
        bpy.context.collection.objects.link(obj)
        return obj
    
    def create_sphere_mesh(name, radius, location):
        """Creates a sphere using bmesh for robustness."""
        bm = bmesh.new()
        bmesh.ops.create_uvsphere(
            bm, u_segments=32, v_segments=16, radius=radius,
            matrix=Matrix.Identity(4) 
        )
        translation_matrix = Matrix.Translation(location)
        bmesh.ops.transform(bm, verts=bm.verts, matrix=translation_matrix)
        
        mesh_data = bpy.data.meshes.new(name + "_Mesh")
        bm.to_mesh(mesh_data)
        bm.free()
        
        obj = bpy.data.objects.new(name, mesh_data)
        bpy.context.collection.objects.link(obj)
        return obj
    
    def clone_lamp(original_pole, original_head, offset_x):
        """Clones the lamp geometry and links the new objects."""
        
        # Clone the Pole
        new_pole = original_pole.copy()
        new_pole.data = original_pole.data # Link to the same mesh data
        new_pole.name = f"{original_pole.name}_Clone"
        new_pole.location.x += offset_x
        bpy.context.collection.objects.link(new_pole)
        
        # Clone the Lamp Head
        new_head = original_head.copy()
        new_head.data = original_head.data # Link to the same mesh data
        new_head.name = f"{original_head.name}_Clone"
        new_head.location.x += offset_x
        bpy.context.collection.objects.link(new_head)
        
        return new_pole, new_head
    
    # --- 3. Create Materials (Moved to top for easy access during cloning) ---
    
    # --- A. Chrome Material for Pole ---
    chrome_mat_name = "ChromeMaterial"
    chrome_mat = bpy.data.materials.get(chrome_mat_name) or bpy.data.materials.new(name=chrome_mat_name)
    chrome_mat.use_nodes = True
    p_bsdf = chrome_mat.node_tree.nodes.get("Principled BSDF")
    if p_bsdf:
        p_bsdf.inputs["Base Color"].default_value = (0.8, 0.8, 0.8, 1)
        p_bsdf.inputs["Metallic"].default_value = 1.0
        p_bsdf.inputs["Roughness"].default_value = 0.1 
    
    # --- B. Emission Material for Lamp Head ---
    emit_mat_name = "EmissionMaterial"
    emit_mat = bpy.data.materials.get(emit_mat_name) or bpy.data.materials.new(name=emit_mat_name)
    emit_mat.use_nodes = True
    e_bsdf = emit_mat.node_tree.nodes.get("Principled BSDF")
    if e_bsdf:
        e_bsdf.inputs["Base Color"].default_value = (0, 0, 0, 1) 
        e_bsdf.inputs["Emission Color"].default_value = (1.0, 1.0, 0.8, 1) 
        e_bsdf.inputs["Emission Strength"].default_value = 1.0 
        e_bsdf.inputs["Roughness"].default_value = 0.5 
    
    # --- 4. Create Geometry for LAMP 1 ---
    
    pole_radius = 0.1
    pole_depth = 3.0
    pole_location = (0, 0, pole_depth / 2) 
    
    pole1 = create_cylinder_mesh(
        "Pole_1", radius=pole_radius, depth=pole_depth, location=pole_location
    )
    lamp_location = (0, 0, pole_depth + 0.15) 
    head1 = create_sphere_mesh(
        "LampHead_1", radius=0.15, location=lamp_location
    )
    
    # Assign Materials to Lamp 1
    pole1.data.materials.append(chrome_mat)
    head1.data.materials.append(emit_mat)
    
    # --- 5. Clone and Position LAMP 2 ---
    
    # Clone the first lamp and offset it by 4 units on the X-axis
    OFFSET_X = 4.0
    pole2, head2 = clone_lamp(pole1, head1, OFFSET_X)
    
    # --- 6. Internal Light Source (For .blend flicker effect) ---
    
    # --- A. Light 1 (Linked to Lamp 1) ---
    light_data_1 = bpy.data.lights.new(name="StreetLightData_1", type='POINT')
    light_data_1.energy = 50 
    light_data_1.temperature = 5500 
    light1 = bpy.data.objects.new(name="StreetLight_1", object_data=light_data_1)
    bpy.context.collection.objects.link(light1)
    light1.location = lamp_location # Location is (0, 0, 3.15)
    
    # --- B. Light 2 (Linked to Lamp 2) ---
    light_data_2 = bpy.data.lights.new(name="StreetLightData_2", type='POINT')
    light_data_2.energy = 50 
    light_data_2.temperature = 5500 
    light2 = bpy.data.objects.new(name="StreetLight_2", object_data=light_data_2)
    bpy.context.collection.objects.link(light2)
    # Offset the light source to match the second lamp
    light2.location.x += OFFSET_X
    light2.location.z = lamp_location[2] # Location is (4.0, 0, 3.15)
    
    
    # --- 7. Defined Flicker Animation using Keyframes & Cycles (Applied to BOTH lights) ---
    
    lights_data = [light_data_1, light_data_2]
    
    for ld in lights_data:
        # Set a 20-frame flicker cycle (dim-off-on snap)
        ld.energy = 100
        ld.keyframe_insert(data_path="energy", frame=1)
        ld.energy = 5 
        ld.keyframe_insert(data_path="energy", frame=5)
        ld.energy = 80 
        ld.keyframe_insert(data_path="energy", frame=10)
        ld.energy = 10 
        ld.keyframe_insert(data_path="energy", frame=15)
        ld.energy = 100 
        ld.keyframe_insert(data_path="energy", frame=20)
    
        fcurve = ld.animation_data.action.fcurves.find("energy")
    
        if fcurve:
            # Set interpolation mode to 'CONSTANT' for an instant on/off look
            for kf in fcurve.keyframe_points:
                kf.interpolation = 'CONSTANT'
                
            # Add a Cycles Modifier to repeat the 1-20 frame flicker endlessly
            modifier = fcurve.modifiers.new(type='CYCLES')
            modifier.mode_before = 'REPEAT'
            modifier.mode_after = 'REPEAT'
            
    # --- 8. Final Scene Settings and GLB Export ---
    
    # Set the scene's frame range to play a few seconds of the flicker
    bpy.context.scene.frame_start = 1
    bpy.context.scene.frame_end = 120 
    
    # Select all relevant objects for export
    bpy.ops.object.select_all(action='SELECT') 
    
    # Define the output path for the GLB file
    glb_output_path = os.path.expanduser("~/street_lamps_dual.glb") 
    
    print(f"\nExporting GLB to: {glb_output_path}")
    
    # Run the GLTF export operator
    bpy.ops.export_scene.gltf(
        filepath=glb_output_path,
        export_format='GLB',            # Export as a single binary file
        use_selection=True,             # Only export selected objects
        export_lights=False,            # Dynamic lights are ignored by GLB
        export_extras=True,             
    )
    print("GLB export successful.")
    
    # --- 9. Save the Resulting Blender File (for debugging/reference) ---
    
    blend_output_path = os.path.expanduser("~/street_lamps_dual.blend") 
    bpy.ops.wm.save_as_mainfile(filepath=blend_output_path)
    print(f"Blender file saved for reference: {blend_output_path}")


    Displaying the Model in the Web Browser

    To display this 3D model on your website we will use the model viewer web component which supports various 3D formats and is easy to embed.

    Using HDR Images for Lighting

    The street lamp will be lit using an HDR environment map in this case the courtyard EXR image found in Blender 45 LTS. HDR images provide realistic lighting and reflections making your model look more lifelike.

    Supported File Formats in Web Browsers

    • .hdr High Dynamic Range good support in browsers especially with model viewer
    • .exr OpenEXR less support natively in browsers but possible with conversions
    • .ktx / .ktx2 Khronos Texture modern formats with support in some browsers

    Open source alternatives

    • .png or .jpg for textures less dynamic range but widely supported
    • glTF .gltf or .glb as a container format that supports embedded textures and is highly supported across browsers

    Running the Python Script

    To run the Python script open your terminal or command prompt navigate to your Blender installation directory and execute:

    blender --background --python your_script.py

    Replace your_script.py with the filename of your script.

    Exporting to GLTF for Browser Use

    The GLTF (GL Transmission Format) is an open standard file format for 3D models that is widely supported across web applications. Once you’ve generated the model, export it in .glb format using the command provided in the Python script. The .glb format is great for web browsers since it is optimized for fast loading and can include textures, animations, and materials.

    bpy.ops.export_scene.gltf(filepath='path/to/exported_model.glb')

    GLTF files can be viewed directly in the browser with <model-viewer>, an easy-to-use web component that supports various 3D formats, including .glb files.

    Displaying the Model locally in the Web Browser with <model-viewer>

    To display your model in a web browser, embed it using the <model-viewer> tag in an HTML document:


        &lt;h1&gt;Street Lamp&lt;/h1&gt;
        &lt;model-viewer src=&quot;path/to/exported_model.glb&quot; alt=&quot;Street Lamp&quot; auto-rotate camera-controls environment-image=&quot;courtyard.hdr&quot; animation-name=&quot;Animation&quot; autoplay&gt;&lt;/model-viewer&gt;


    Be sure to replace path/to/exported_model.glb with the actual path to your .glb file.

    📸 Screenshots & Screencast
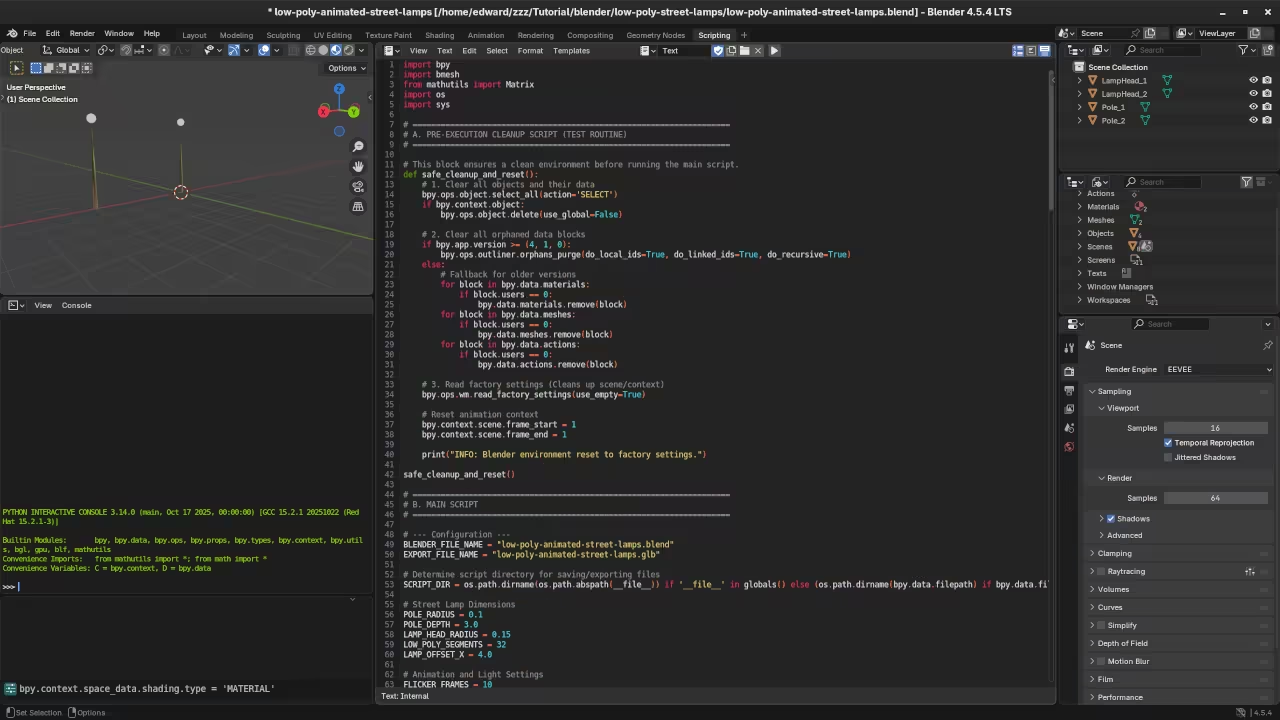
    Low poly street-lamps Python code
    Blender Scripting Workspace Displaying Low Poly Wall Tiled Corner Python Code

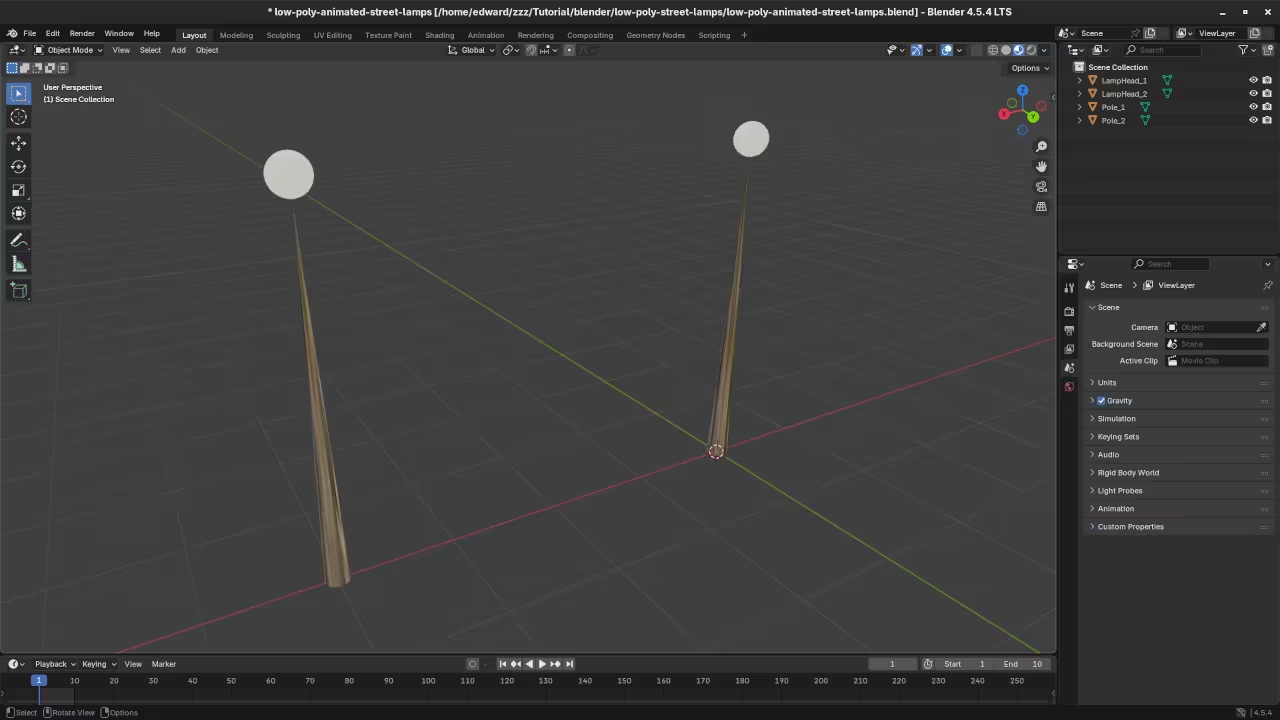
    Low poly street-lamps in Blender
    Blender Layout Workspace Displaying Low Poly Wall Tiled Corner

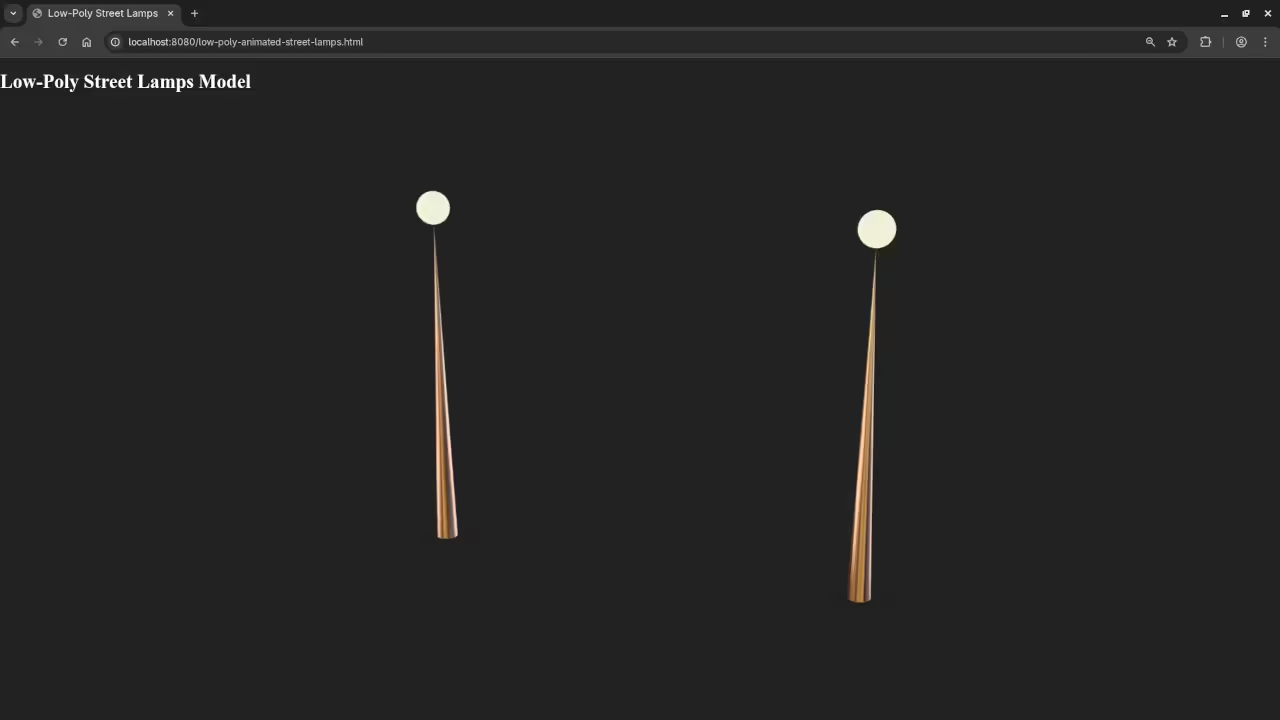
    Low poly street-lamps in Web browser
    Web Browser Displaying Rendered Low Poly Wall Tiled Corner

    Screencast For Blender Python API Low Poly Wall Tiled Corner

    Resources and Further Reading

    I have two books that might interest you:

    You can also check out my course:

    And I am available for one-on-one online Python tutorials including Blender. Contact me here:
    https://ojambo.com/contact

  • LosslessCut Immediately Cuts Videos

    LosslessCut Immediately Cuts Videos


    Review of LosslessCut: A Powerful Open-Source Video Cutter for Quick Edits on Fedora Linux

    When it comes to video editing, sometimes you don’t need all the bells and whistles-just a tool to cut out parts of a video quickly and without loss of quality. If that’s the case for you, LosslessCut is a fantastic option to consider. This open-source video cutter is lightweight, user-friendly, and works on multiple platforms, including Linux. In this post, we’ll explore how to install LosslessCut on Fedora Linux and highlight its key features for those looking to make quick video edits.

    What is LosslessCut?

    LosslessCut is a simple, cross-platform video editing tool designed to cut video and audio files without re-encoding. As the name suggests, the software operates in a “lossless” manner, meaning it doesn’t degrade the quality of the original video. This makes it perfect for those who just want to trim or split large videos into smaller parts, such as removing sections from a long presentation or trimming excess footage from a recording.

    LosslessCut supports a wide range of video and audio formats, including MP4, MKV, MOV, and more. Whether you’re cutting out unnecessary segments or creating shorter clips for social media, LosslessCut does it without the usual overhead of traditional video editors.

    Installation of LosslessCut on Fedora Linux

    There are two primary ways to install LosslessCut on Fedora Linux: through Flathub or using the AppImage. Both methods are straightforward and effective, depending on your preference for package management or direct installation. Let’s look at both.

    1. Installing LosslessCut from Flathub

    Flathub is a popular source for Flatpak applications. If you’re comfortable using Flatpak on your Fedora system, here’s how to install LosslessCut:

    1. Install Flatpak (if not already installed):
      sudo dnf install flatpak
    2. Add Flathub repository (if not already added):
      flatpak remote-add --if-not-exists flathub https://flathub.org/repo/flathub.flatpakrepo
    3. Install LosslessCut:
      flatpak install flathub no.mifi.losslesscut
    4. Once installed, you can launch LosslessCut directly from the app menu or by running:
      flatpak run no.mifi.losslesscut

    2. Installing LosslessCut via AppImage

    Alternatively, you can download and run LosslessCut using an AppImage, which is a self-contained executable that runs on most Linux distributions.

    1. Download the latest AppImage from the official LosslessCut GitHub Releases page.
    2. Make the AppImage executable:
      chmod +x LosslessCut-x.x.x.AppImage
    3. Run the AppImage:
      ./LosslessCut-x.x.x.AppImage

    The AppImage method is great because you don’t need to install anything globally-just download the file, make it executable, and run it. It’s as easy as that!

    Using LosslessCut to Edit Videos

    Once installed, you can start using LosslessCut to cut parts out of your videos. Here’s a quick rundown of how to get started:

    1. Open LosslessCut from your application launcher or by running the AppImage.
    2. Click on the “Open File” button and select the video you want to edit.
    3. Use the timeline to select the start and end points for the cut.
    4. Click the “Cut” button to create your trimmed video file. LosslessCut will perform the cut without re-encoding, preserving the original quality.
    5. You can export the video in the format of your choice or simply save the cut segments.

    Note: LosslessCut also supports trimming audio files, so if you need to remove sections from an audio track, you can do that as well!

    Why Choose LosslessCut?

    LosslessCut shines in its simplicity. It’s not a full-featured video editor-there are no fancy transitions, filters, or color correction tools-but for quick, lossless video editing, it’s perfect. Here are a few key reasons to choose LosslessCut:

    • Open Source: It’s free to use and its code is available on GitHub, so you can contribute or customize it as needed.
    • Fast & Efficient: Since it cuts without re-encoding, it’s much faster than traditional video editors.
    • Cross-Platform: Works on Linux, macOS, and Windows.
    • Minimalist Interface: Easy to use, even for beginners.

    If you often find yourself trimming long videos or extracting short clips, LosslessCut is a tool you’ll appreciate.

    📷 Screenshots

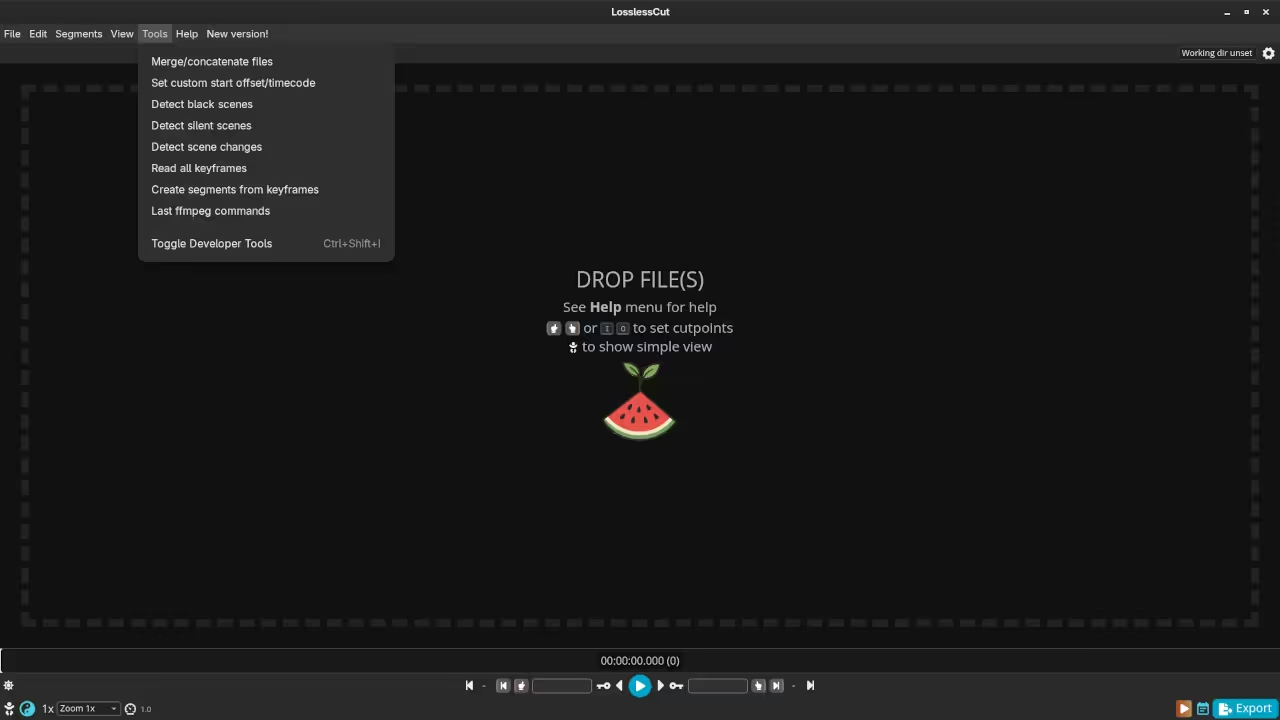
    LosslessCut Tools Menu
    LosslessCut Tools Menu Screen

    LosslessCut Video Editor
    LosslessCut Video Editor Screen

    🎬 Live YouTube Screencast

    Video Displaying The Installation And Use Of LosslessCut On Linux

    Related Resources

    If you’re interested in programming and software development, I also offer various learning resources that may interest you:

    • Programming Books: Check out my collection of programming books on Amazon.
    • Online Programming Courses: Take a look at my programming courses to further enhance your coding skills.
    • One-on-One Programming Tutorials: Need help with coding or video editing? I’m available for personalized tutorials. Learn more at Ojambo Contact.
    • Open Source Software Services: I also provide consulting services, including installation and configuration of LosslessCut and other open-source video editors. Get in touch at Ojambo Services.
  • NetBeans 28 Advanced Editor Review

    NetBeans 28 Advanced Editor Review


    Getting Started with NetBeans: A Powerful Open-Source IDE for Developers

    NetBeans is a free, open-source Integrated Development Environment (IDE) that has been widely used for building applications in multiple programming languages. Whether you’re a beginner or a seasoned developer, NetBeans provides a rich feature set for coding, debugging, and managing projects with ease. In this blog post, we will explore the features, installation process (with a focus on Fedora Linux), and how you can get started using NetBeans today.

    What is NetBeans?

    NetBeans is an open-source IDE that supports Java, PHP, HTML, JavaScript, and many other programming languages. It provides a variety of features designed to improve the productivity of developers, including intelligent code completion, project management, debugging, and version control integration.

    It is backed by the Apache Software Foundation and has a dedicated community of developers constantly working to improve its functionality.

    Features of NetBeans

    • Multi-language Support: NetBeans supports many programming languages, including Java, C, C++, PHP, JavaScript, and HTML.
    • Smart Code Completion: The IDE provides intelligent code suggestions and auto-completions to speed up development.
    • Integrated Debugger: You can easily debug your code, step through it line-by-line, and catch errors early.
    • Version Control Integration: NetBeans integrates with Git and Subversion, making it easy to manage and track your code revisions.
    • Rich Plugin Ecosystem: Extend NetBeans with additional features by installing plugins directly from the IDE.

    Licensing and Open-Source Nature

    NetBeans is released under the Apache License 2.0, making it free to use, modify, and distribute. Since it’s open-source, you can contribute to its development or tailor it to your own needs.

    For more information on the license, you can refer to Apache NetBeans Licensing.

    How to Install NetBeans on Fedora Linux

    If you’re using Fedora Linux, installing NetBeans is a straightforward process. Here’s how you can get it up and running on your system:

    Step 1: Install Java Development Kit (JDK)

    NetBeans requires a JDK (Java Development Kit) to run. First, make sure you have OpenJDK installed. You can install it via the terminal with:

    sudo dnf install java-11-openjdk-devel

    Step 2: Install NetBeans

    Once you have Java installed, you can install NetBeans from the official Fedora repositories:

    sudo dnf install netbeans

    Alternatively, you can download the latest version of NetBeans directly from the official NetBeans website. Simply select the version that suits your platform, and follow the installation instructions provided.

    Step 3: Launch NetBeans

    After installation, you can launch NetBeans by either finding it in your application menu or typing the following command in your terminal:

    netbeans

    Requirements For Programming Text Editor

    Glossary:

    Code Editor

    Designed for writing and editing source code.

    IDE

    Integrated Development Environment combines various tools need for software development.

    Plugin

    Software component that adds specific functionality.

    Theme

    Preset package containing graphical appearance to customize look and feel.

    Open source

    Freely available for possible modification and redistribution.

    SCM

    Source code management use to manage and track modifications to a source code repository.

    LMB

    Left Mouse Button (LMB) or left click

    MMB

    Middle Mouse Button (MMB) or scroll wheel

    Test Tools

    Test System
    Name Description
    CPU Ryzen 5 5600GT @ 3.60GHz.
    Memory 32GB DDR4.
    Operating System Fedora Linux Workstation 43.
    Desktop Environment Gnome 49.
    Name Description

    Test Suite
    Name Description
    Large File 1GB human-readable text.
    Regex File Text with word “Helix” repeated.
    Syntax File PHP file containing HTML, CSS & JavaScript.
    Media File Smiley face or Tux Linux JPEG file.
    Java Version OpenJDK 21.0.9.
    PHP Version PHP 8.4.14.
    Python Version Python 3.14.0.
    Netbeans Version 28
    Name Description

    Test Scoring

    1. Each feature has two parts.
    2. Score of zero indicates a missing feature.
    3. A part of a feature is work a score of 0.5.

    Three bias elimination steps were utilized. The editor was used for at least three years on different platforms. Attempts were made to get stable plug-ins for missing features. The same editor was compared between the one in the repository, the developers website, and the compiled version if applicable.

    Selecting Editor Version

    For this review, Netbeans was downloaded from the developers website and it did not require additional plugins.

    Features

    1. The theme can be native for the editor in terms of the background, and the dark theme did not need tweaks for source code management. Netbeans comes with dark and light themes and others can be created or downloaded. The score for the theme was 1.0.
    2. Dragging and dropping a text file into the editor opens a new tab. It is still not possible to specify the tab location during the drag and drop operation. The score for drag and drop into editor was 0.5.
    3. Opening a very large text file did not crash Netbeans. An out of memory window was shown and it was not possible to edit the large file. The score for opening a large file was 0.5.
    4. Multiple documents can opened in multiple tabs. Tear-off tabs work by opening a new Netbeans editor instances which is handy for multiple monitors. The score for multiple documents was a perfect 1.0.
    5. Multiple editors can be opened as new tabs with drag options. Every new editor tab can be split vertically or horizontally. The score for multiple editor view was a perfect 1.0.
    6. Creating non-project files is possible by dragging the folder into the workspace. Non-project files can be opened by the drag and drop operation. The score for creating non-project files was a perfect 1.0.
    7. Soft word wrap can be enabled in the editor settings. Automatic soft wrap for documents is available for Netbeans. The score for word wrap was a perfect 1.0.
    8. Spell check works as words are typed. Spelling errors are shown in opened documents. The score for spell check was a perfect 1.0.
    9. Word count is not available for Netbeans. Selection word count is not available. The score for word count was 0.0.
    10. Go to line CTRL-G can jump to a specified line. It is possible to jump to either the first or last line. The score for go to line was a perfect 1.0.
    11. Indentation can default to user-defined tab stops. Children are automatically indented. The score for indentation was a perfect 1.0
    12. Fonts can be dynamically scaled using ALT-MMB. The system font can be bypassed and a new editor font and size can be set. The score for fonts was a perfect 1.0.
    13. Find and replace using regular expressions can be utilized for all open documents in the current session. Find and replace will work for the current document or a selection in the current document. The score for find and replacing using regular expressions was 1.0.
    14. Multiple language syntax highlighting in one file is enabled if the language plug-ins are installed. Each language has code-sensitive syntax colors which can be modified. The score for multiple language syntax highlighting was a perfect 1.0.
    15. Code folding works for markup languages such as HTML. Code folding also works for programming languages such as Java and PHP. The score for code folding was 1.0.
    16. Selecting rectangular block per column works via a toggle or CTRL-SHIFT-R on Linux. Rectangular block selections work with word wrap enabled. The score for selecting rectangular block was a perfect 1.0.
    17. Multiple selection works using the shortcut CTRL-SHIFT-LMB or CMD-SHIFT-LMB on Macs. Search multiple selection is not available. The score for multiple selection was 0.5.
    18. Distraction-free mode to hide panes works. Line numbers can be toggled to improve distraction-free mode. The score for distraction-free was a perfect 1.0.
    19. The file manager can create and delete folders. Media files can be dragged and dropped into the file manager pane. The score for file manager was a perfect 1.0.
    20. Terminal is integrated into Netbeans. The terminal can follow folder. Terminal can execute system commands. The score for terminal was 1.0.

    Results

    Netbeans is a very powerful IDE. By default, the Netbeans editor is no longer missing required features which can be installed by using extensions. For my required features, the Netbeans editor scored 87.5% or 8.75 out of 10.

    📱 Screenshots

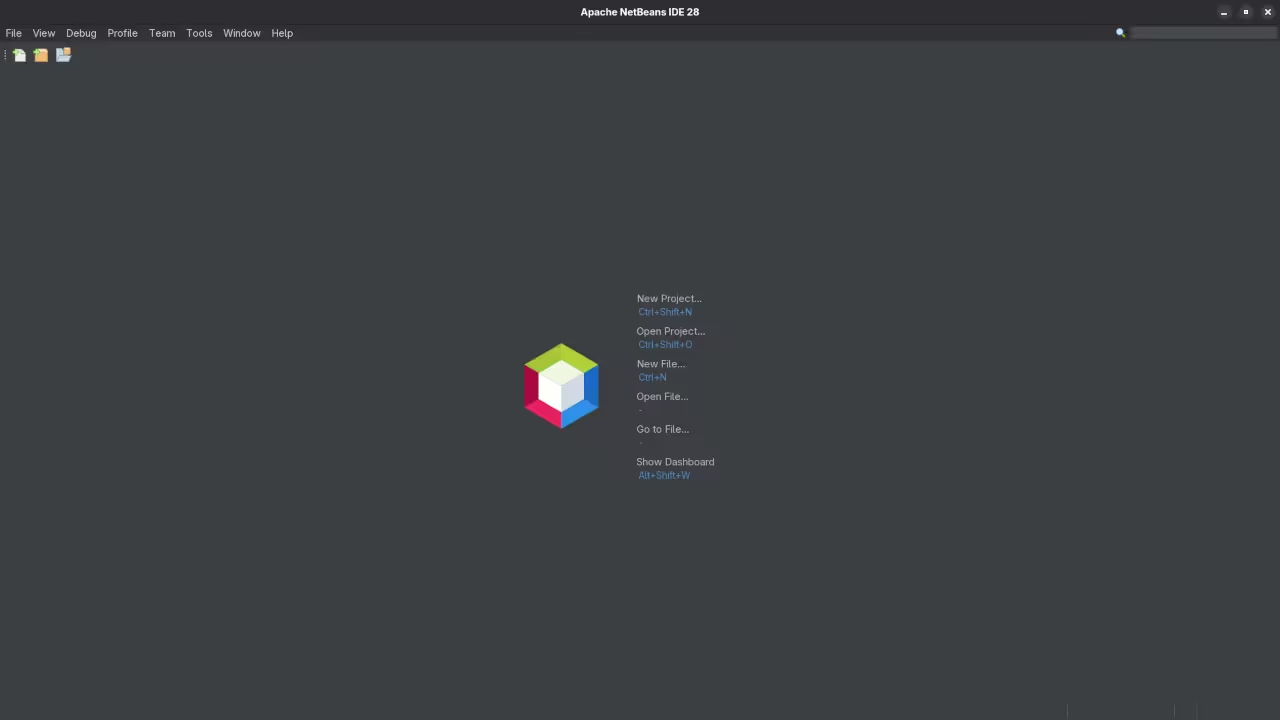
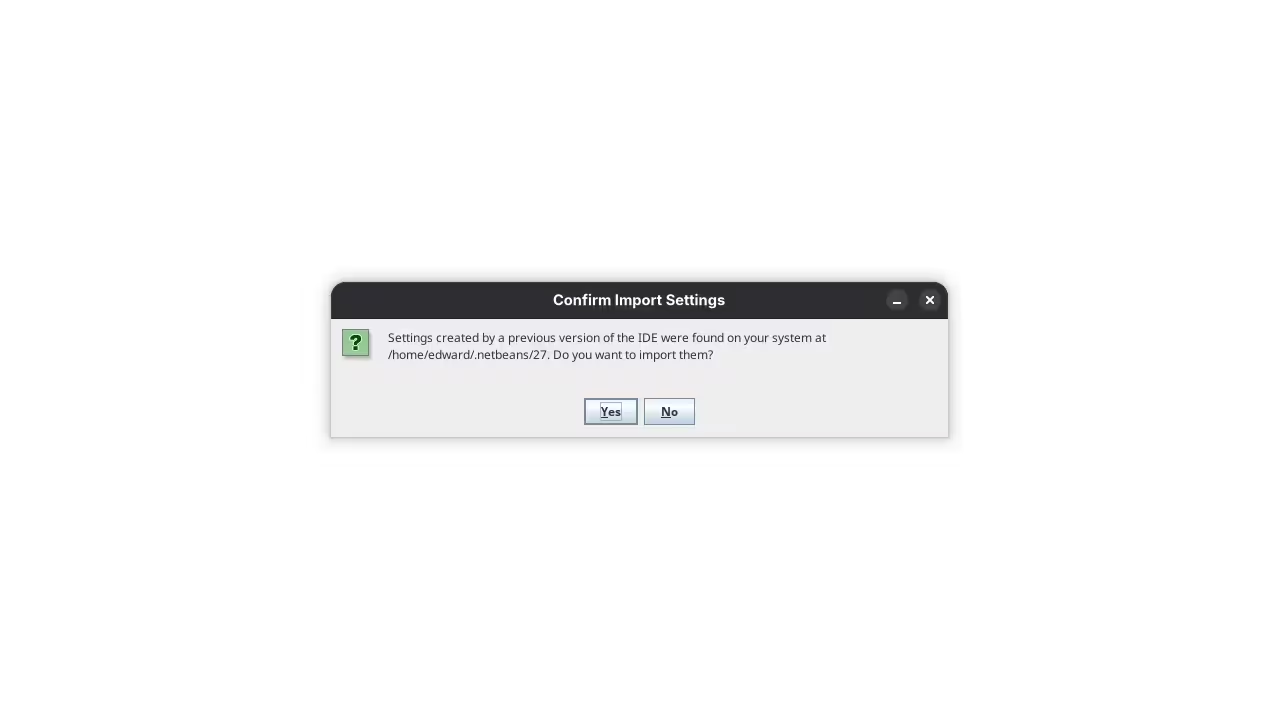
    Netbeans 28 Import Settings
    Apache Netbeans 28 Dialog To Import Settings From Previous Version

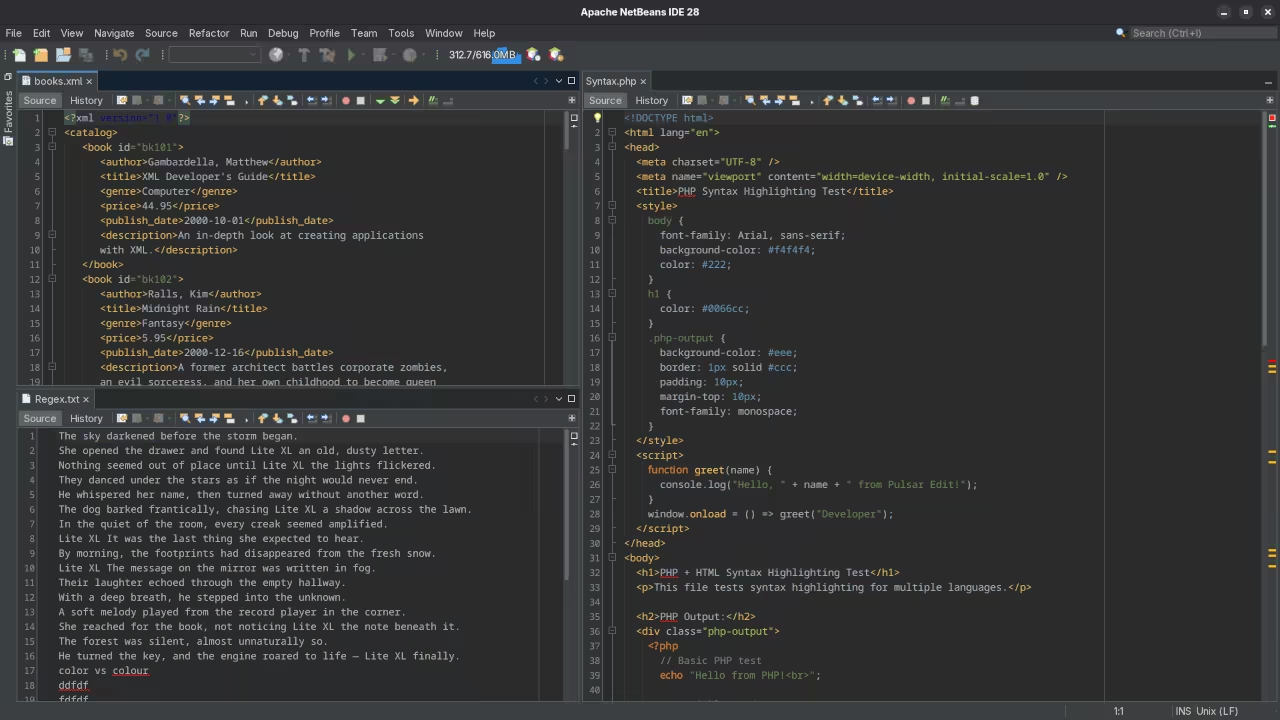
    Netbeans 28 Split View
    Apache Netbeans 28 Multiple Editor Split View

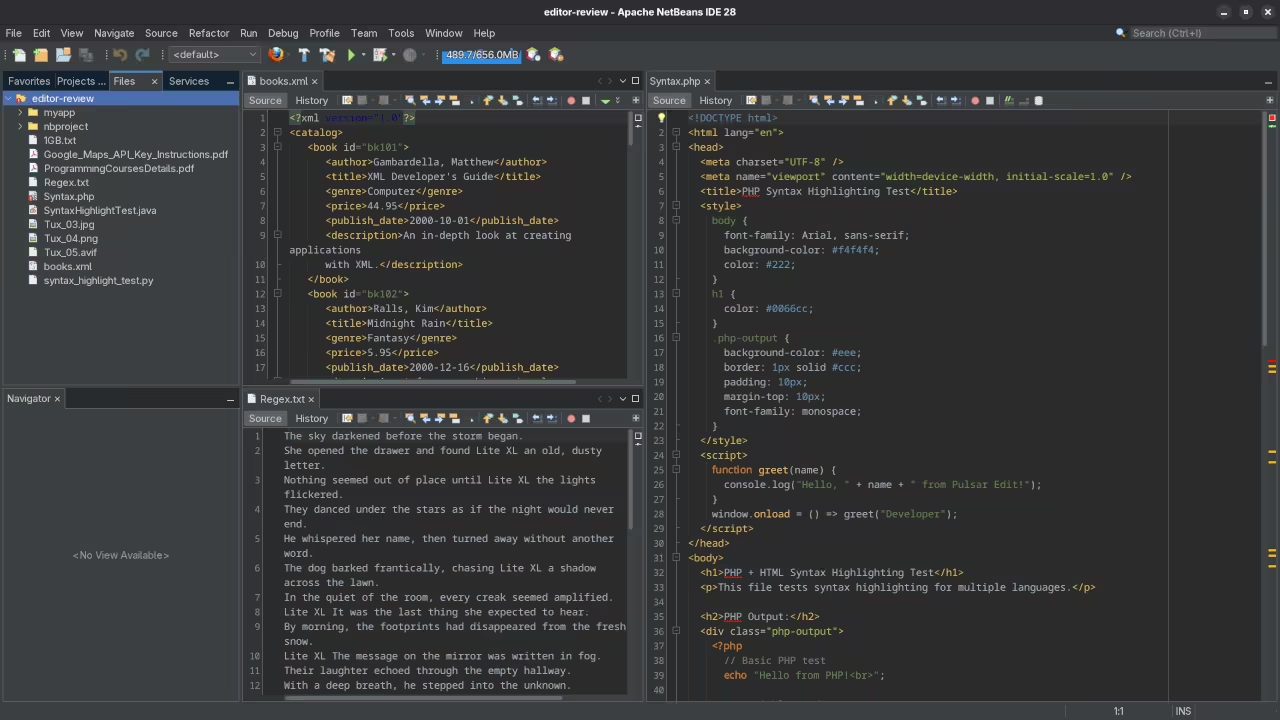
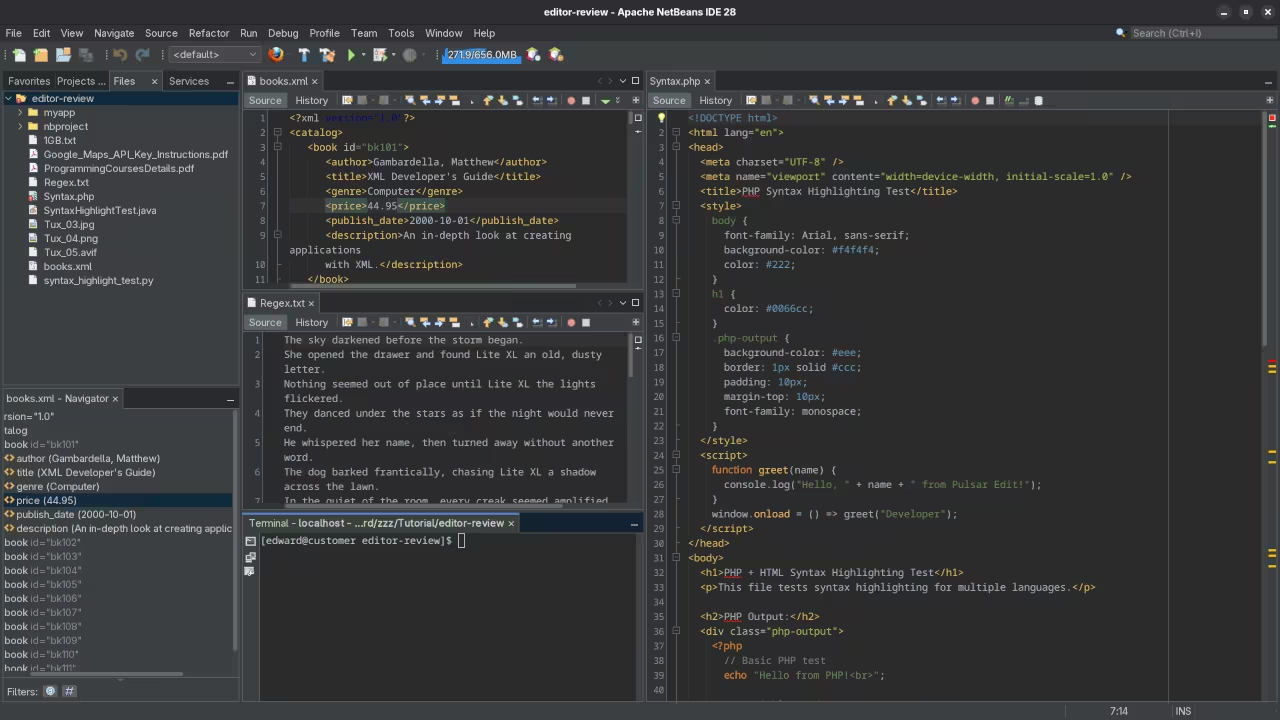
    Netbeans 28 Folder View
    Apache Netbeans 28 Installed Folder View

    Netbeans 28 Terminal View
    Apache Netbeans 28 Terminal View

    🞍 Screencast Tour

    Take a guided walk-through of some of NetBeans 28’s best new features—from database tools to testing frameworks:

    Apache Netbeans 28 Tour And Review

    Additional Resources

    For those looking to dive deeper into programming, I offer a selection of programming books and online courses that can help you master different programming languages and tools.

    One-on-One Programming Tutorials

    If you need personalized help with NetBeans or any other programming topic, I offer one-on-one online programming tutorials. You can schedule a session with me via my contact page.

    NetBeans Installation and Migration Services

    I also provide NetBeans installation and migration services if you need assistance setting up or moving your projects. Visit my contact page to learn more.

  • How to Self-Host Hoodik: An Open-Source Cloud Storage

    How to Self-Host Hoodik: An Open-Source Cloud Storage


    Getting Started with Hoodik: The Open-Source Personal Storage Solution

    If you’re looking for a self-hosted, open-source solution to manage and store your personal files, photos, documents, and more, Hoodik is a great option. In this guide, we’ll walk you through setting up Hoodik using Podman (or Podman Compose) for a quick start. Whether you’re a beginner or an experienced container user, you’ll find this guide helpful.

    What is Hoodik?

    Hoodik is an open-source, self-hosted file storage solution designed to give you control over your data. It allows you to store, manage, and access your personal files, photos, and documents securely from anywhere. The best part? Since it is self-hosted, you maintain full control of your data, without relying on third-party cloud providers.

    Step 1: Setting Up Hoodik with Podman

    If you are familiar with Docker, using Podman for container management will feel similar. The main difference is that Podman doesn’t require a central daemon, which makes it more lightweight and secure.

    Installing Hoodik with Podman

    1. Install Podman (if not already installed):

    • On Ubuntu:
      sudo apt update && sudo apt install -y podman
    • On Fedora:
      sudo dnf install -y podman
    • On macOS (via Homebrew):
      brew install podman

    2. Pull the Hoodik Image:
    Once Podman is installed, you can pull the official Hoodik image from the registry:

    podman pull hudik/hoodik:latest

    3. Running the Hoodik Container:
    Run the following command to start the Hoodik container:

    podman run -d -p 8443:5443 hudik/hoodik:latest

    This command will expose Hoodik on port 8443. You can visit https://localhost:8443 in your browser to check if it’s running.

    Using Podman Compose (Optional)

    If you prefer using a structured approach with a compose file, Podman Compose works similarly to Docker Compose. Follow these steps:

    1. Create a podman-compose.yml file (the syntax is compatible with Docker Compose):

    version: '3.8'
    
    services:
      hoodik:
        image: hudik/hoodik:latest
        container_name: hoodik_test
        restart: "no"  # Use 'no' to prevent automatic restart during testing
        ports:
          - "8443:5443"  # Map host port 8443 to container port 5443
        volumes:
          - ./data:/data  # Map local data directory to /data inside the container
        environment:
          - DATA_DIR=/data
          - APP_URL=https://my-app.local
          - SSL_CERT_FILE=/data/my-cert-file.crt.pem
          - SSL_KEY_FILE=/data/my-key-file.key.pem
          - MAILER_TYPE=smtp
          - SMTP_ADDRESS=smtp.gmail.com
          - SMTP_USERNAME=email@gmail.com
          - SMTP_PASSWORD=google-account-app-password
          - SMTP_PORT=465
          - SMTP_DEFAULT_FROM_EMAIL=email@gmail.com
          - SMTP_DEFAULT_FROM_NAME=Hoodik Drive
    
    volumes:
      data:
        driver: local
      

    2. Start the container using Podman Compose:

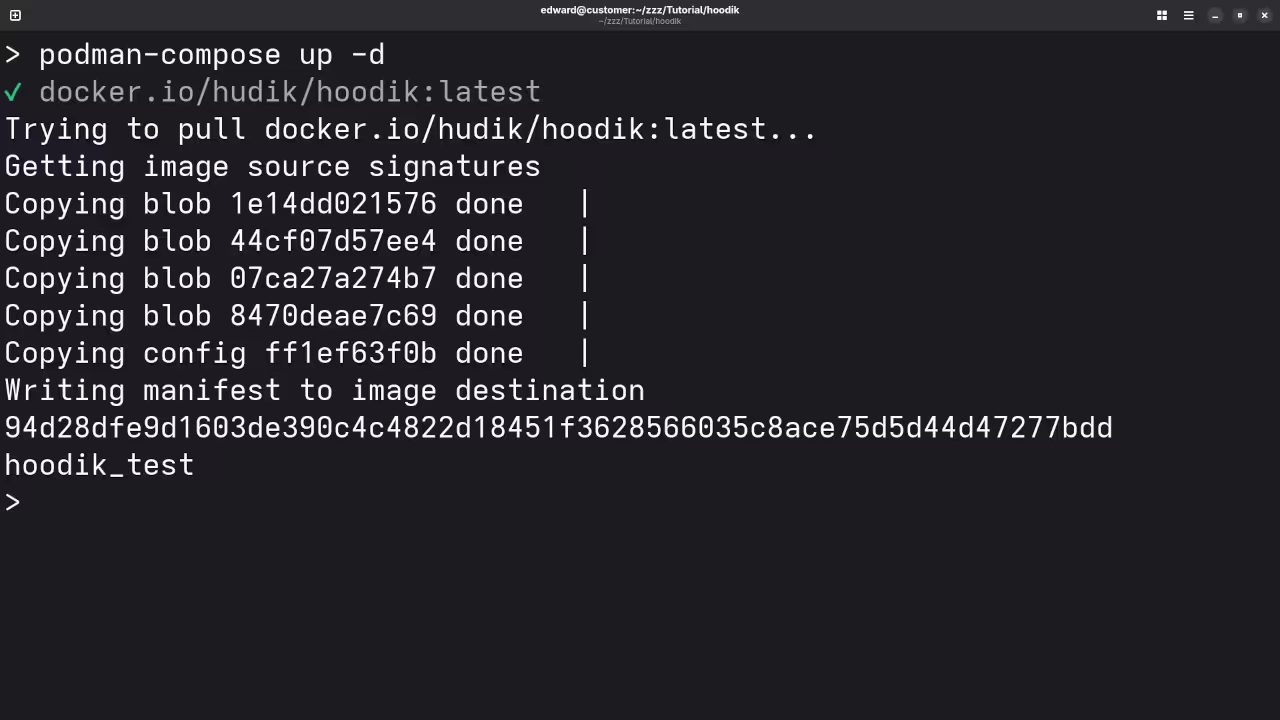
    podman-compose up -d

    Step 2: Managing Your Personal Files

    Once the Hoodik container is running, you can access your personal storage dashboard via your browser at https://localhost:8443. Here, you can upload, organize, and manage your files, photos, and documents. Hoodik provides a simple, user-friendly interface for managing your personal data securely.

    📱 Screenshots & Screencast

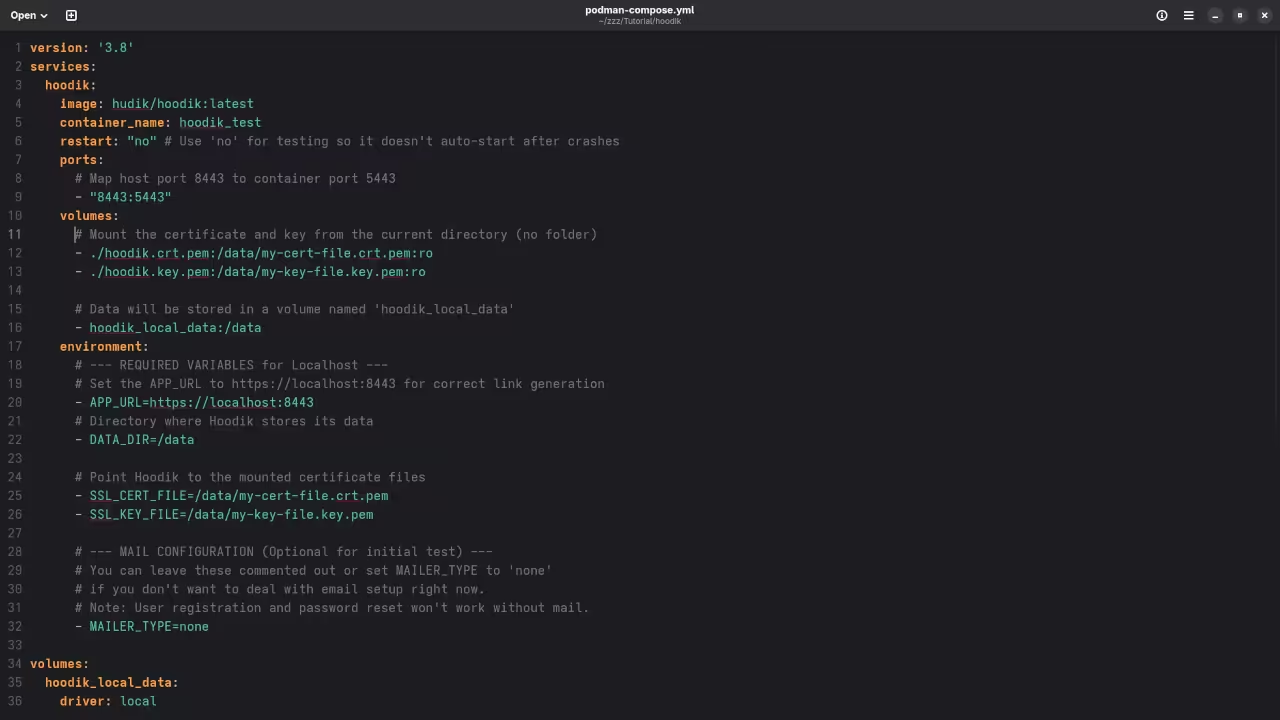
    Hoodik Compose YAML File
    Gnome Text Editor Displaying Hoodik Compose YAML File

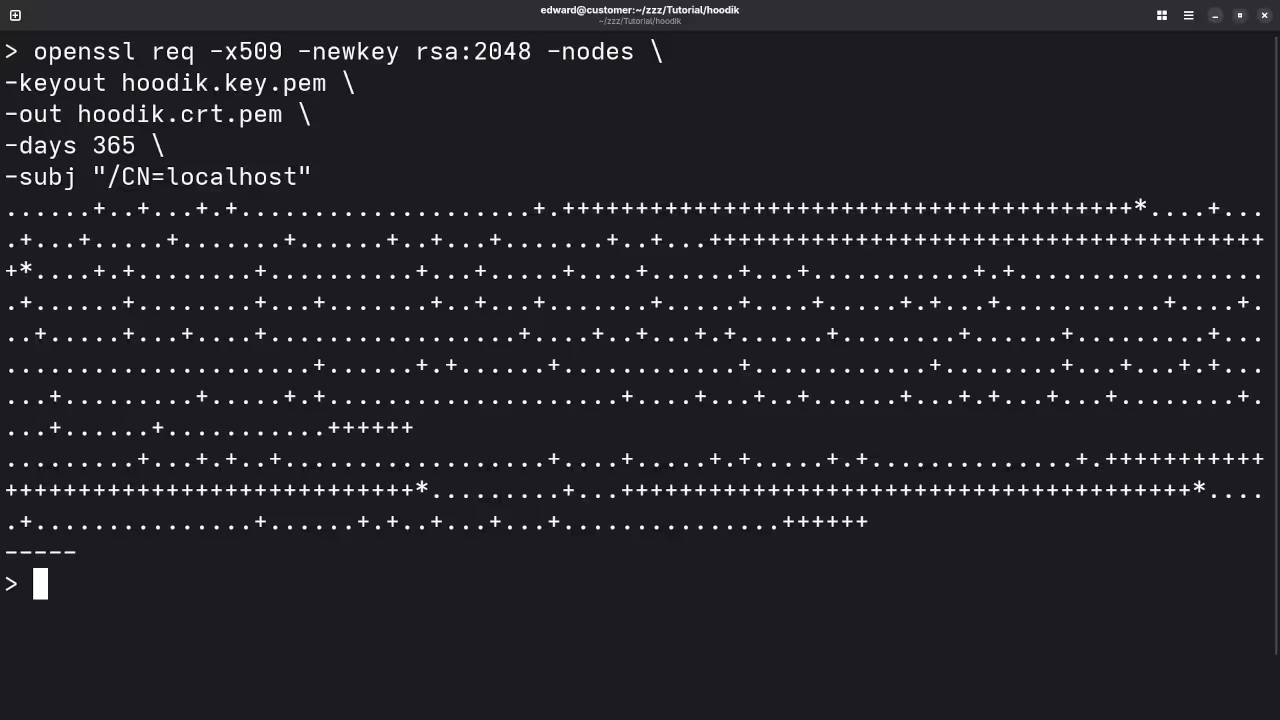
    Hoodik Podman SSL Certificate
    Command Line Generation Of Hoodik Self-signed SSL Certificate

    Hoodik Podman Compose Build
    Command Line Installation Of Hoodik Via Podman Compose Build

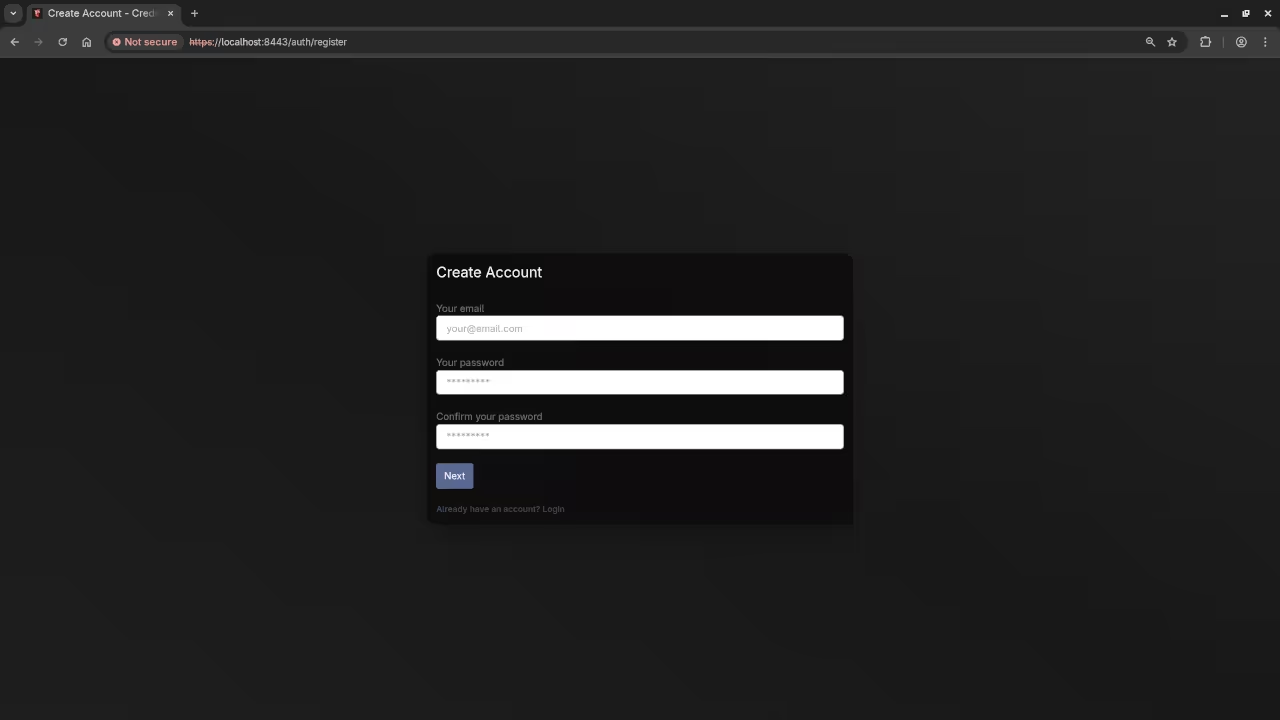
    Hoodik User Creation
    Web Browser Displaying Hoodik User Creation Screen

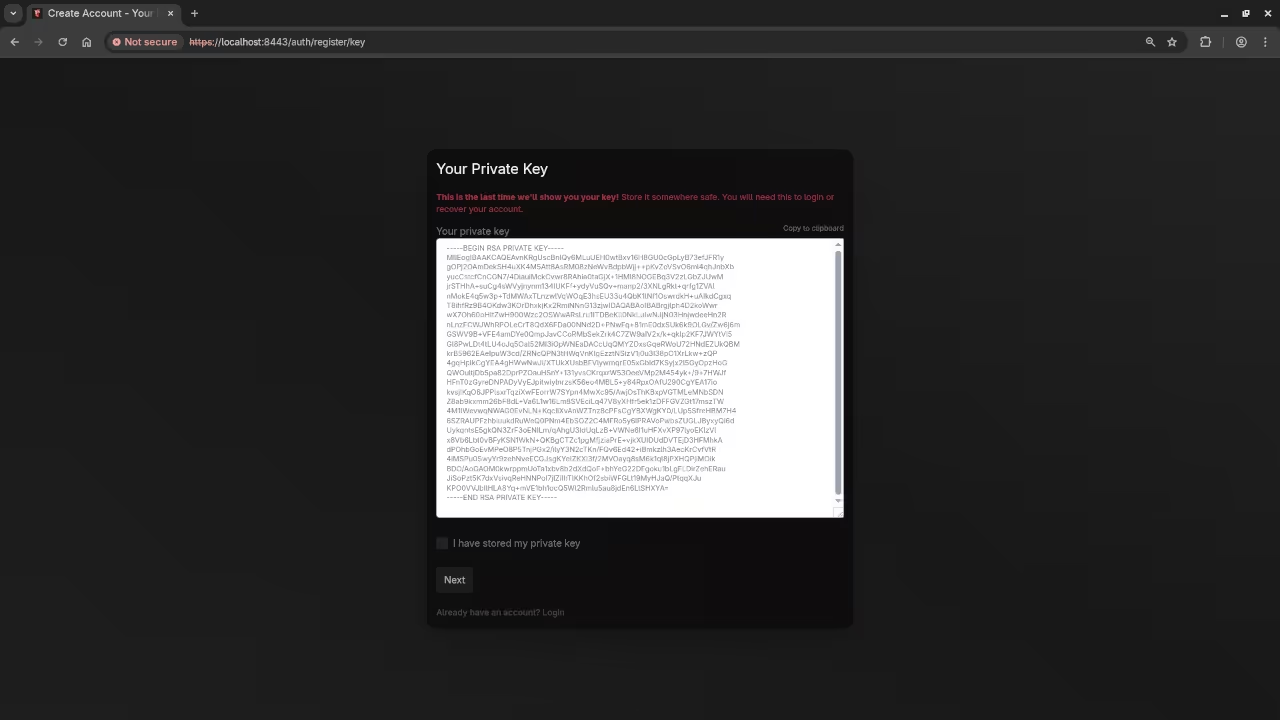
    Hoodik Private Key
    Web Browser Displaying Hoodik Private Key Generation Screen

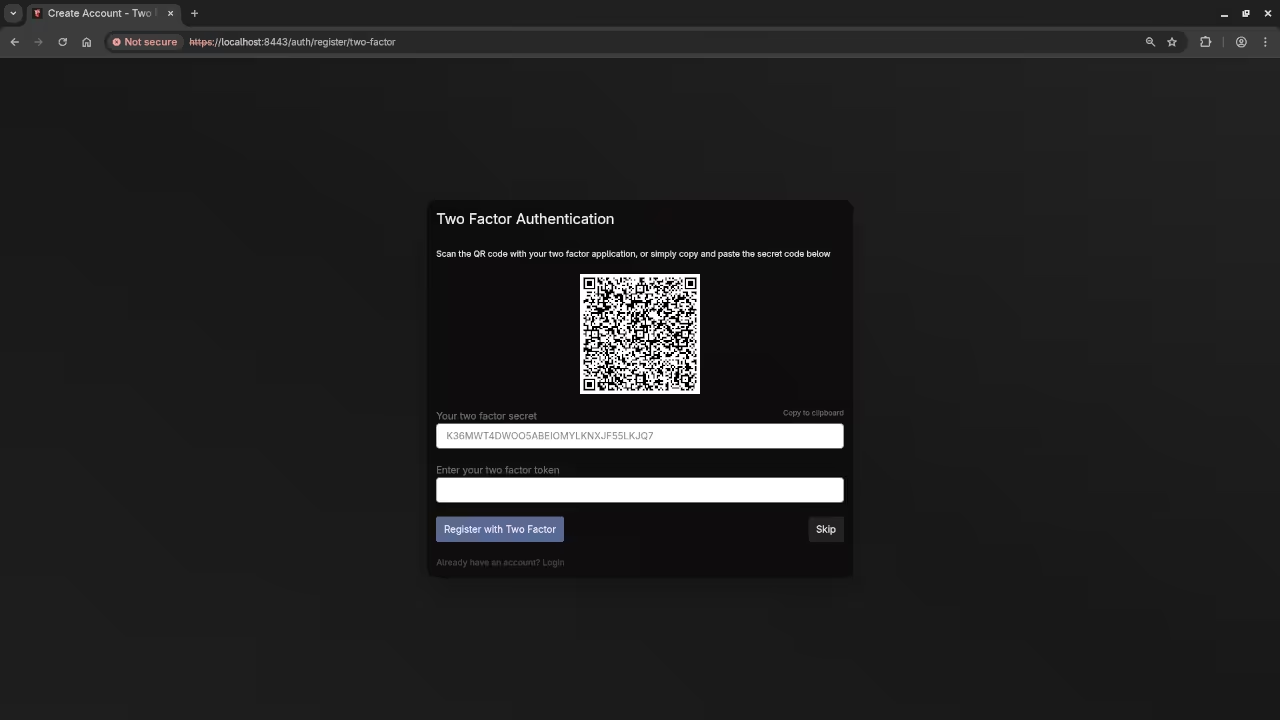
    Hoodik 2FA
    Web Browser Displaying Hoodik Two Factor Authentication Screen

    Hoodik Login
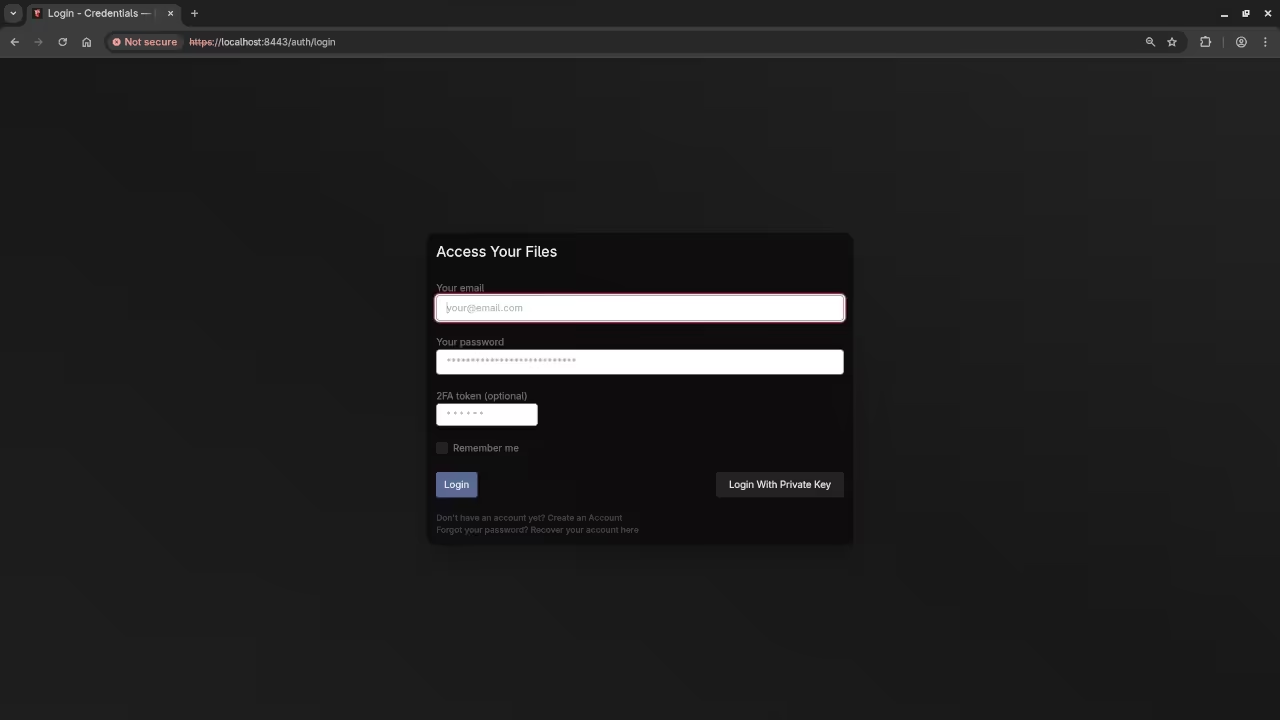
    Web Browser Displaying Hoodik Login Screen

    Hoodik Settings
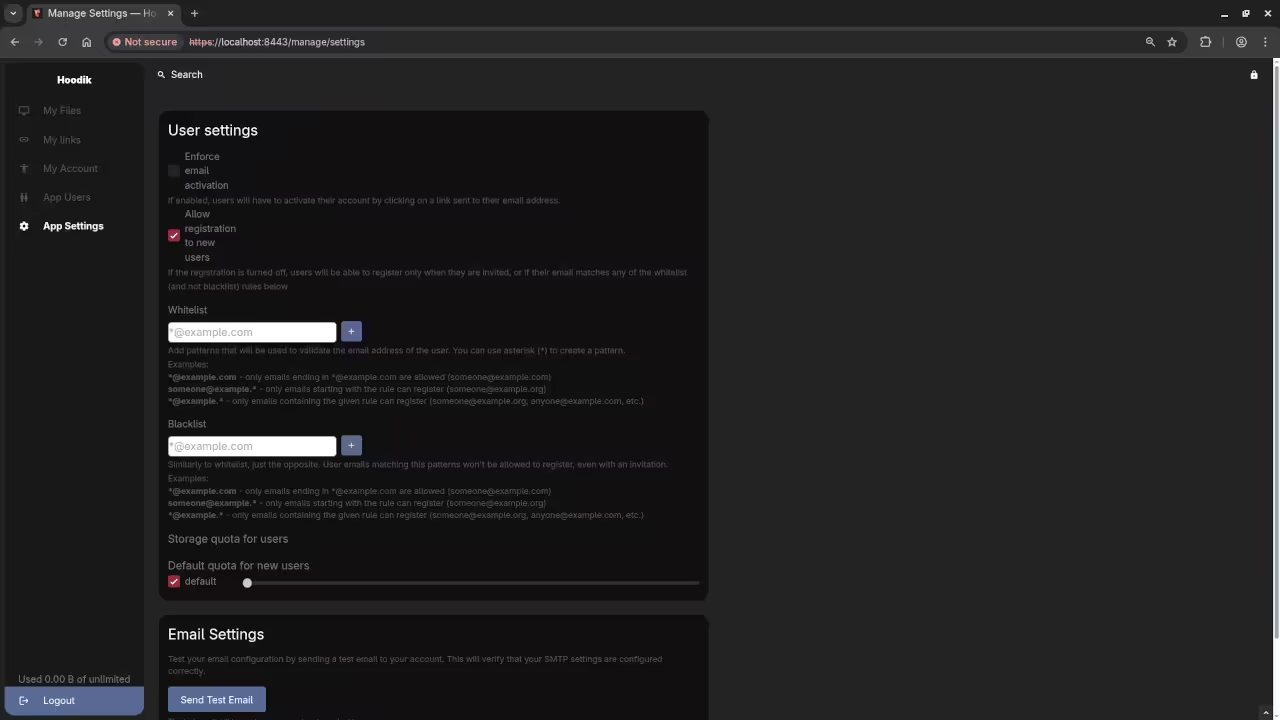
    Web Browser Displaying Hoodik User Settings Screen

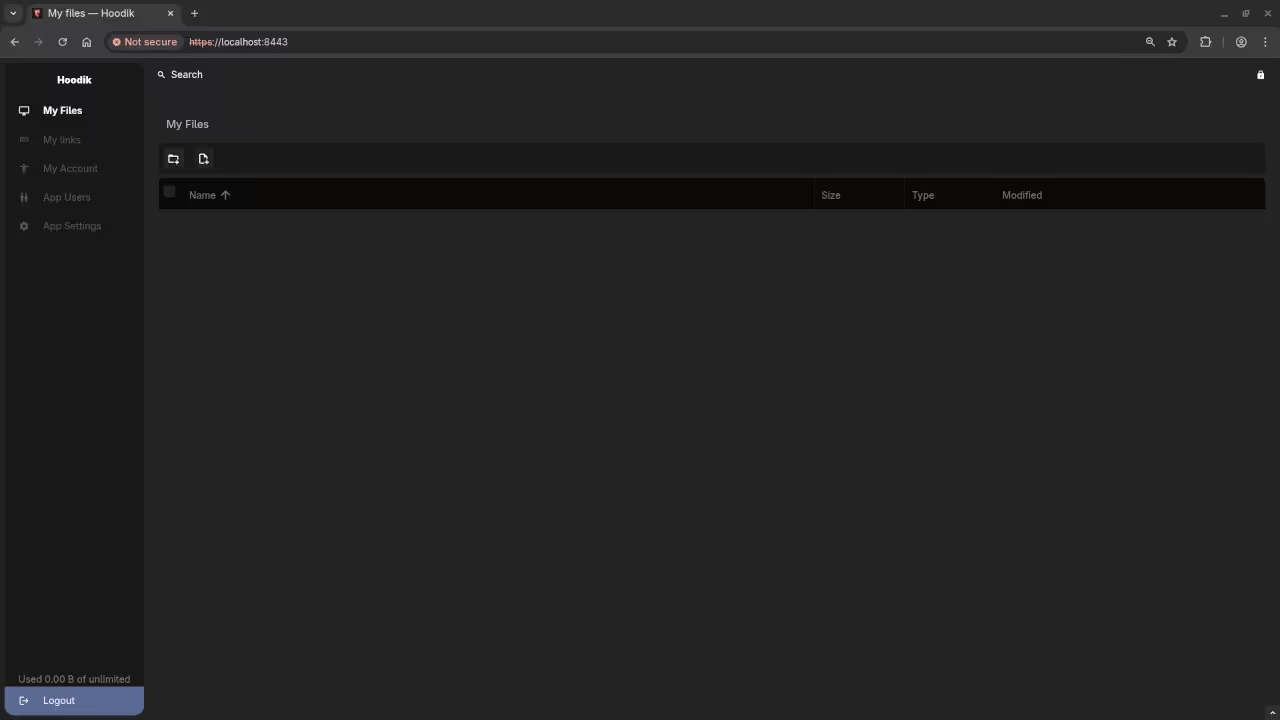
    Hoodik FIles
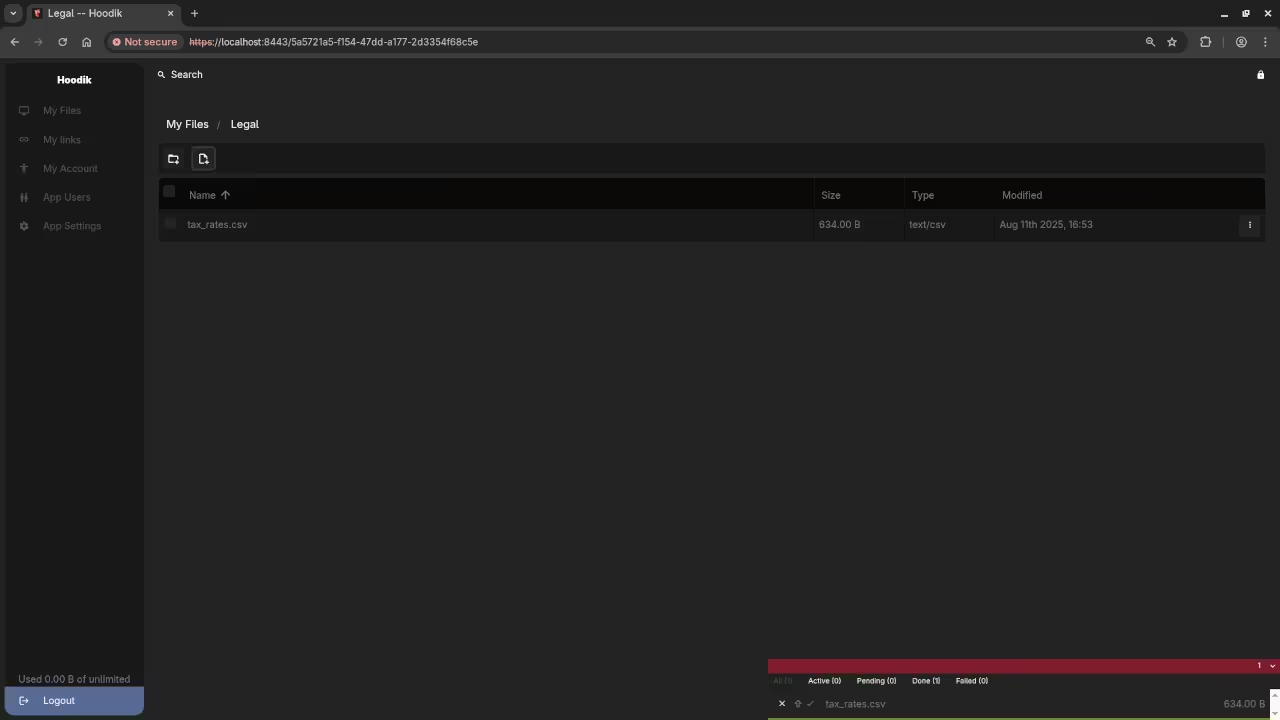
    Web Browser Displaying Hoodik Files Screen

    Hoodik Installation And Setup Screencast

    More Learning Resources

    If you are diving into programming or looking to enhance your skills, I have a variety of resources available:

    • Programming Books: Check out my collection of programming books available on Amazon.
    • Programming Courses: Explore my programming courses on OjamboShop.
    • One-on-One Programming Tutorials: I offer personalized, one-on-one programming tutorials. You can contact me through my online contact page.
    • Hoodik Installation and Migration Services: I can help you install or migrate your Hoodik setup. Reach out via my service page.

    Conclusion

    By now, you should have Hoodik up and running as your own personal storage solution. Whether you want to organize photos, store documents, or manage other types of files, Hoodik gives you full control over your data and how it is accessed.

    If you have any questions or need assistance along the way, feel free to reach out. I am happy to help with installation, migration, or anything else you may need. Happy storing!

  • LibreOffice Writer Llama.cpp Integration Using AMD Instinct MI60 GPU

    LibreOffice Writer Llama.cpp Integration Using AMD Instinct MI60 GPU


    Getting Started with LibreOffice + Llama.cpp Integration on Linux with AMD Instinct Mi60 GPU

    If you are a Linux user looking to leverage AI capabilities with LibreOffice, this guide will show you how to integrate Llama.cpp into LibreOffice Writer using your AMD Instinct Mi60 32GB HBM2 GPU. This setup allows AI-powered text assistance directly within LibreOffice.

    System Requirements

    Before you start, make sure your system meets the following:

    • Operating System: Linux (tested on Fedora 43)
    • CPU: Modern multi-core processor
    • GPU: AMD Instinct Mi60 with 32GB HBM2 memory
    • RAM: 32GB or higher recommended
    • Storage: Minimum 50GB free space
    • Software:
      • LibreOffice (latest stable version)
      • Llama.cpp (compiled for Linux with GPU support)
      • Python 3.10+ (for scripting and plugin integration)
      • Optional: Python AI libraries for extended functionality

    Installation & Configuration

    Step 1: Launch LibreOffice with Socket Connection

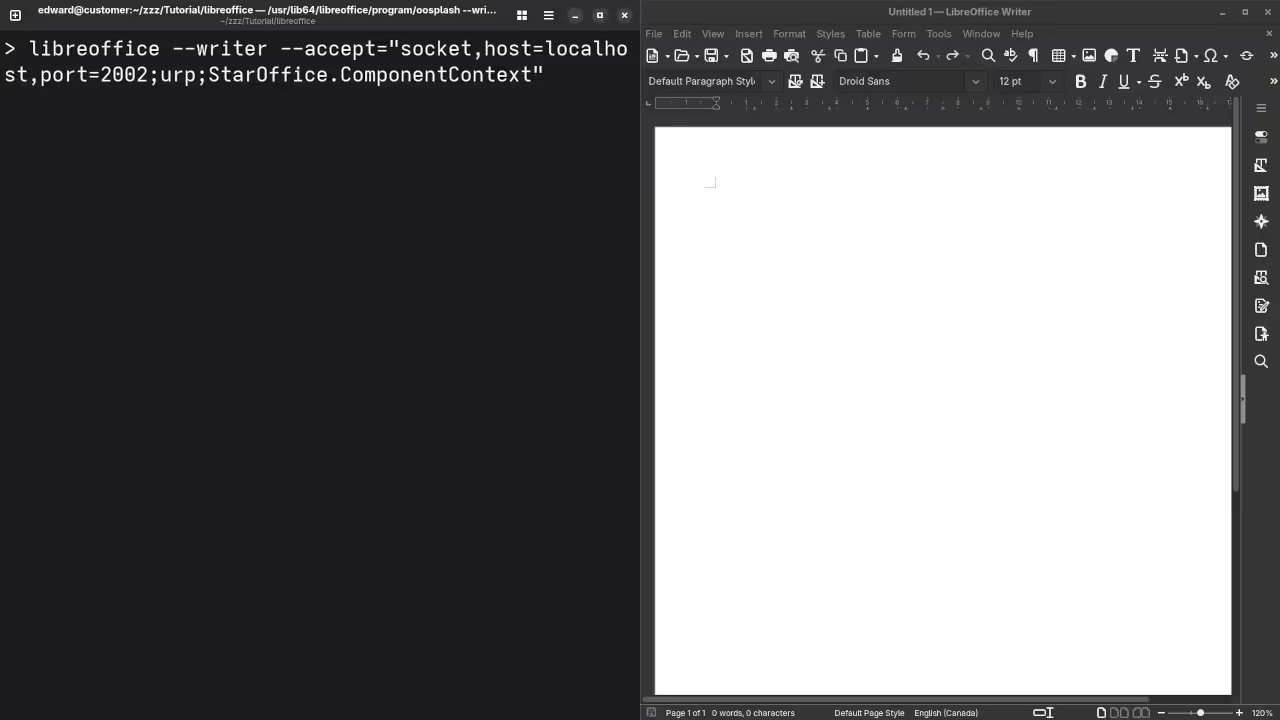
    First, launch LibreOffice Writer in listening mode to accept connections. You can do this using the following command in your terminal:

    libreoffice --writer --accept="socket,host=localhost,port=2002;urp;StarOffice.ComponentContext"

    This command allows other programs like Llama.cpp to send data into LibreOffice Writer via a TCP/IP socket connection.

    Step 2: Install and Run Llama.cpp

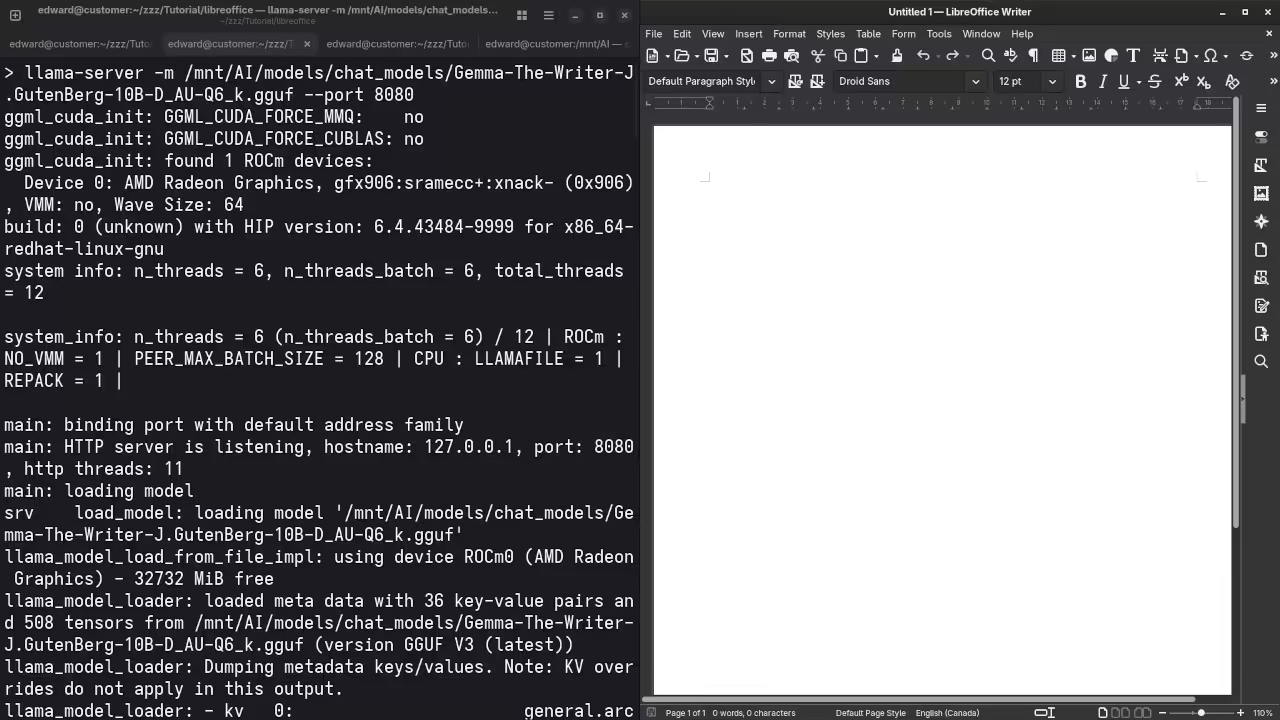
    Llama.cpp is used for running the LLaMA models on your system (in this case, it will run on the AMD Instinct Mi60). Assuming you have already set up Llama.cpp (compiled for Linux with GPU support), you would start it up using a command like:

    ./llama -m /path/to/your/model --port 2002

    This ensures that Llama.cpp is actively listening for connections on the same port as LibreOffice, allowing data exchange.

    Step 3: Python Script to Send Text to LibreOffice

    Now we will write a Python script that integrates Llama.cpp with LibreOffice. The Python script will interact with both:

    • Llama.cpp (to generate AI-powered text)
    • LibreOffice (to display that text inside a Writer document)

    Here is a simple example:


    import uno
    import subprocess
    
    # Function to connect to LibreOffice through UNO (Universal Network Objects)
    def connect_to_libreoffice():
        local_context = uno.getComponentContext()
        resolver = local_context.ServiceManager.createInstanceWithContext(&quot;com.sun.star.bridge.UnoUrlResolver&quot;, local_context)
        context = resolver.resolve(&quot;uno:socket,host=localhost,port=2002;urp;StarOffice.ComponentContext&quot;)
        desktop = context.ServiceManager.createInstanceWithContext(&quot;com.sun.star.frame.Desktop&quot;, context)
        return desktop.getCurrentComponent()
    
    # Function to interact with Llama.cpp (simulate AI prompt generation)
    def generate_text_with_llama(prompt):
        result = subprocess.run([&#039;./llama&#039;, &#039;-m&#039;, &#039;/path/to/your/model&#039;, &#039;--prompt&#039;, prompt], capture_output=True, text=True)
        return result.stdout.strip()
    
    # Main function
    def main():
        # Connect to LibreOffice
        doc = connect_to_libreoffice()
    
        # Generate text using Llama.cpp
        prompt = &quot;Write a short paragraph on AI in everyday life.&quot;
        generated_text = generate_text_with_llama(prompt)
    
        # Insert the generated text into the LibreOffice document
        cursor = doc.Text.createTextCursor()
        doc.Text.insertString(cursor, generated_text, False)
    
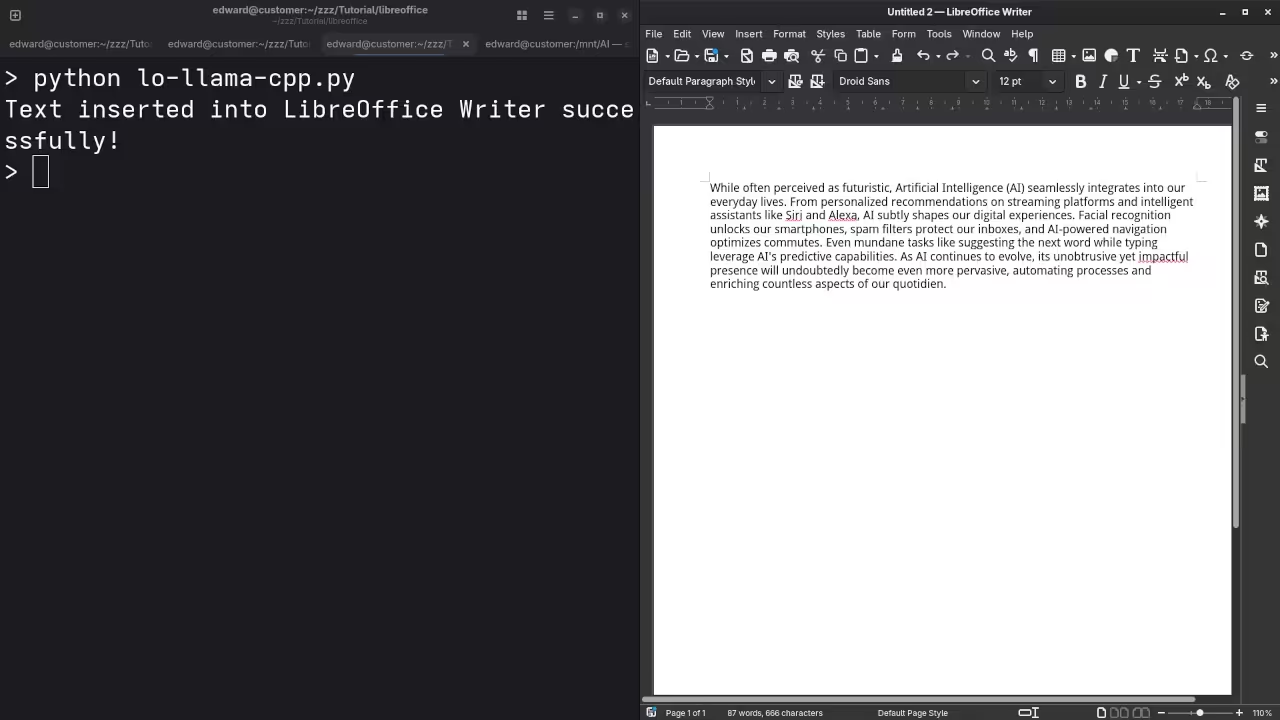
        print(&quot;Text inserted into LibreOffice Writer successfully!&quot;)
    
    if __name__ == &quot;__main__&quot;:
        main()


    Breakdown of the Python Script:

    • connect_to_libreoffice(): This function connects to the running instance of LibreOffice using the UNO API and the socket interface.
    • generate_text_with_llama(): This function runs Llama.cpp as a subprocess, passing a prompt and receiving the AI-generated text output. In this case, it prompts Llama.cpp to generate a short paragraph on AI.
    • main(): This ties everything together:
      • Connect to LibreOffice.
      • Generate text with Llama.cpp.
      • Insert the generated text into the LibreOffice Writer document.

    Step 4: Test Your Setup

    Once you have everything running, here is how you can test it:

    • Start LibreOffice with the socket command.
    • Start Llama.cpp.
    • Run the Python script.

    Check your LibreOffice Writer document to see if the AI-generated text appears.

    Test Tools

    Test System
    Name Description
    CPU AMD Ryzen 5 5600GT (6C/12T, 3.6GHz).
    Memory 32GB DDR4.
    GPU AMD Instinct MI60 (32GB HBM2).
    Operating System Fedora Linux Workstation 43.
    Desktop Environment Gnome 49.
    Name Description

    Screenshots and Screencast

    Here’s where you’ll find a visual walkthrough of setting up v1-5-pruned-emaonly-fp16.safetensors using ComfyUI on your local system:

    LibreOffice Listener Mode
    Command Line Launching UNO Server For LibreOffice Writer.

    llama.cpp Web Server
    Command Line Launching llama.cpp Web Server/API Backend.

    LibreOffice llama.cpp LLM answered question about the Mayor
    Command Line LibreOffice llama.cpp LLM Answered Mayor Of Toronto Request.

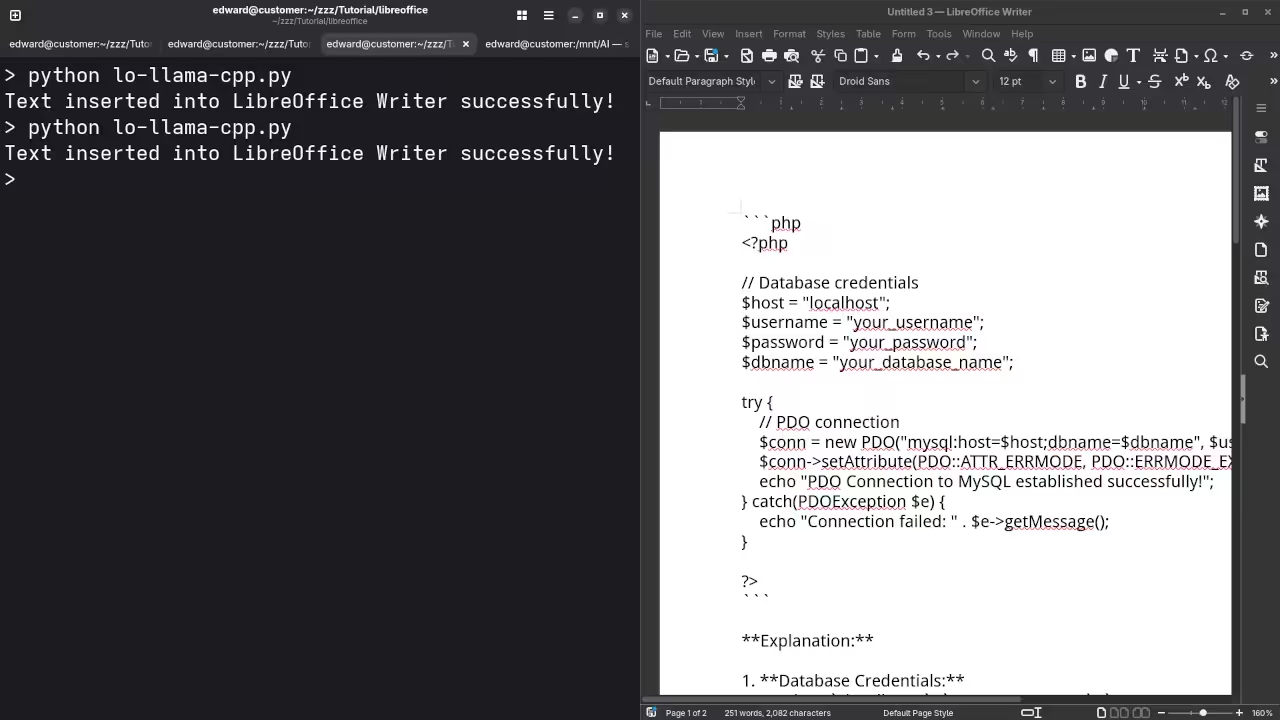
    LibreOffice llama.cpp LLM answered question about PHP code
    Command Line LibreOffice llama.cpp LLM Answered PHP Code Request.

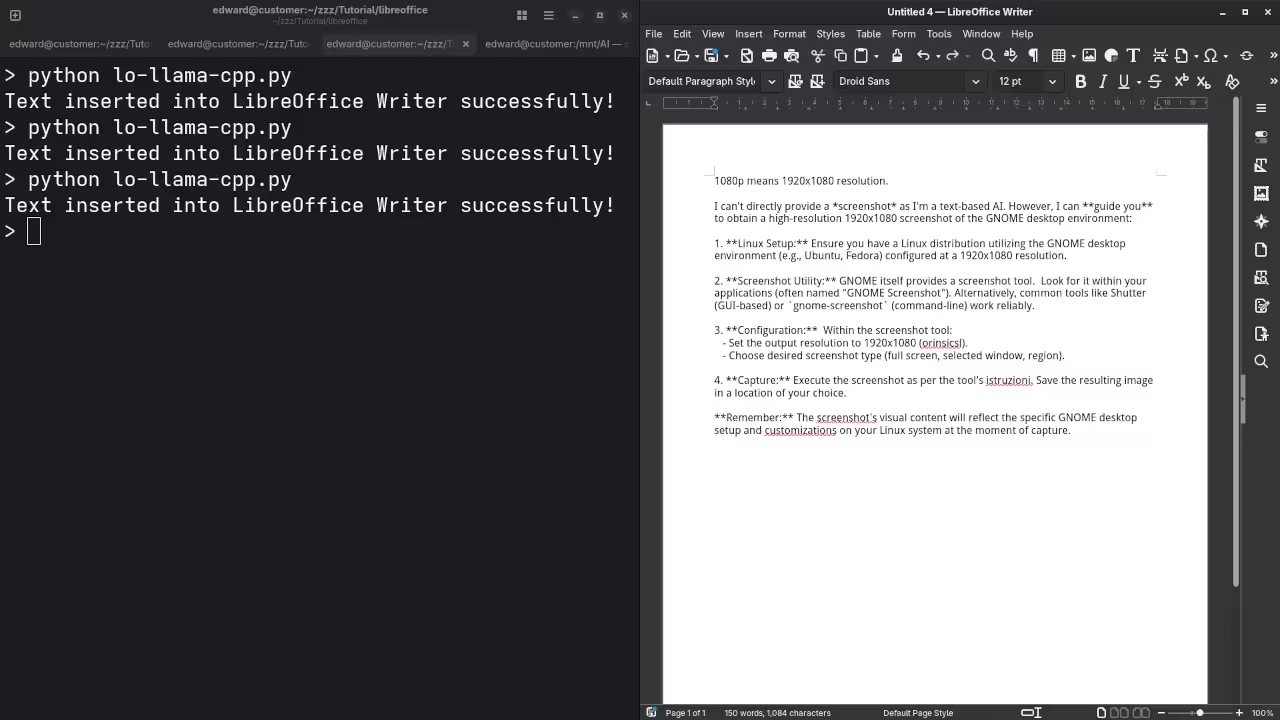
    LibreOffice llama.cpp LLM answered question about screenshot
    Command Line LibreOffice llama.cpp LLM Answered Gnome Desktop Screenshot Request.

    LibreOffice llama.cpp LLM answered request for Kotlin code
    Command Line LibreOffice llama.cpp LLM Answered Kotlin Code Request.

    LibreOffice llama.cpp LLM answered request for Blender Blend File
    Command Line LibreOffice llama.cpp LLM Answered Blender Blend File Request.

    Video Displaying Using llama.cpp For LibreOffice Writer With ROCm 6.4 And AMD Instinct MI60 GPU

    Video Displaying Using llama.cpp For LibreOffice Writer With Gemma Writer LLM

    Results:

    Who is the mayor of Toronto?

    Produced accurate current answer to Olivia Chow as the mayor of Toronto.

    I need a PHP code snippet to connect to a MySQL database.

    Produced correct syntax PHP code snippet to connect to a MySQL database.

    I need a 1080p screenshot of the gnome desktop environment.

    Accurately provided instructions to generate a 1080p screenshot of Gnome desktop environment because it is a text-based AI lacking ability.

    I need a kotlin code snippet to open the camera using Camera2 API and place the camera view on a TextureView.

    Never completed, had to restart server to produce untested Kotlin code snippet.

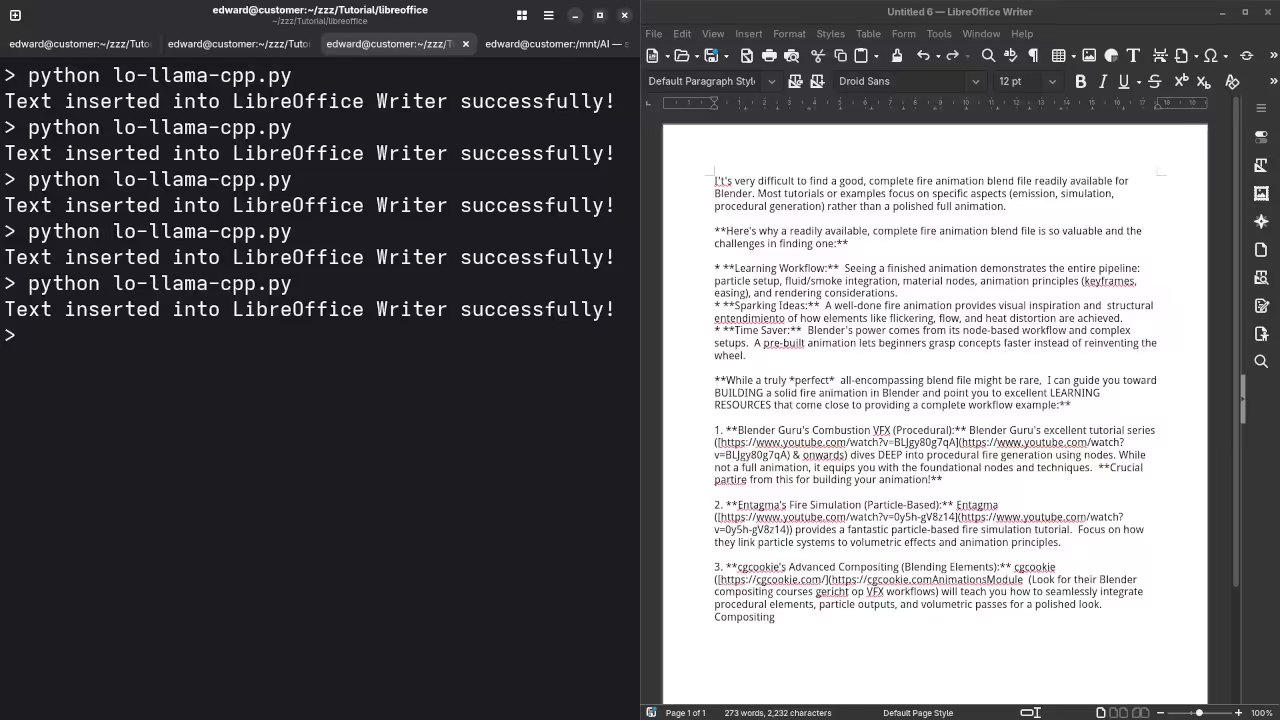
    I need a blender blend file for fire animation.

    Accurately detected inability to generate Blender Blend file for a fire animation because it is a text-based AI lacking ability.

    Additional Resources

    If you are interested in more about Python or AI development, check out these resources:

    If you need one-on-one assistance or want me to help you install LibreOffice or Llama.cpp, I am available for personal tutorials and service requests:

    By adding these code snippets and step-by-step instructions, beginners can follow along more easily and get a working example running without missing critical steps.

  • PHP Dynamically Plotting HTML5 Graphs Using MariaDB

    PHP Dynamically Plotting HTML5 Graphs Using MariaDB

    Beginner Guide to PHP MariaDB and Dynamic Canvas Plotting with CRUD

    This guide introduces a simple way for beginners to use PHP with MariaDB to create a basic data system that can add update delete and display information as a live canvas graph in the browser. The approach is light easy to follow and does not require any advanced tools or frameworks.

    What This Guide Covers

    You will learn how to build a MariaDB table and connect it to PHP so you can create update and remove records. You will also learn how to fetch the data in JSON format and use plain JavaScript to draw a bar graph with the HTML canvas element. The graph updates automatically whenever the database changes.

    Creating the MariaDB Table

    Start by creating a table to store a category and a number value for each record. This keeps the structure simple and easy for beginners to understand. The table will store an id a text label and a number that you will later plot on the canvas.


    CREATE TABLE stats (
        id INT AUTO_INCREMENT PRIMARY KEY,
        category VARCHAR(255) NOT NULL,
        value INT NOT NULL
    );


    Using PHP for Basic Data Operations


    $host = &quot;localhost&quot;;
    $dbname = &quot;testdb&quot;;
    $username = &quot;root&quot;;
    $password = &quot;&quot;;
    
    try {
        $pdo = new PDO(&quot;mysql:host=$host;dbname=$dbname&quot;, $username, $password);
        $pdo-&gt;setAttribute(PDO::ATTR_ERRMODE, PDO::ERRMODE_EXCEPTION);
    } catch (PDOException $e) {
        die(&quot;Database Connection Failed: &quot; . $e-&gt;getMessage());
    }


    PHP will handle the tasks that communicate with the database. You will create one script to add data one script to update data one script to delete data and one script to fetch all the data so your browser can show it. Each file uses clear steps that a beginner can read and understand without difficulty.

    Fetching Data for the Graph


    include &#039;db.php&#039;;
    
    $stmt = $pdo-&gt;query(&quot;SELECT * FROM stats ORDER BY id ASC&quot;);
    $data = $stmt-&gt;fetchAll(PDO::FETCH_ASSOC);
    
    echo json_encode($data);


    Insert Script


    include &#039;db.php&#039;;
    
    $category = $_POST[&#039;category&#039;];
    $value = $_POST[&#039;value&#039;];
    
    $stmt = $pdo-&gt;prepare(&quot;INSERT INTO stats (category, value) VALUES (?, ?)&quot;);
    $stmt-&gt;execute([$category, $value]);
    
    echo &quot;Inserted&quot;;


    Update Script


    include &#039;db.php&#039;;
    
    $id = $_POST[&#039;id&#039;];
    $category = $_POST[&#039;category&#039;];
    $value = $_POST[&#039;value&#039;];
    
    $stmt = $pdo-&gt;prepare(&quot;UPDATE stats SET category = ?, value = ? WHERE id = ?&quot;);
    $stmt-&gt;execute([$category, $value, $id]);
    
    echo &quot;Updated&quot;;


    Delete Script


    include &#039;db.php&#039;;
    
    $id = $_POST[&#039;id&#039;];
    
    $stmt = $pdo-&gt;prepare(&quot;DELETE FROM stats WHERE id = ?&quot;);
    $stmt-&gt;execute([$id]);
    
    echo &quot;Deleted&quot;;


    Your JavaScript code will request the data from the PHP fetch script then read each record and draw a bar for it on the canvas. The drawing process uses the rectangle function of the canvas context and places each bar at regular spacing across the chart area. When the data changes the chart is redrawn so the viewer always sees the latest values.

    Drawing the Canvas Graph


    &lt;div&gt;
        &lt;h3&gt;Add or Update Record&lt;/h3&gt;
    
        &lt;input type=&quot;hidden&quot; id=&quot;id&quot;&gt;
    
        &lt;input type=&quot;text&quot; id=&quot;category&quot; placeholder=&quot;Category&quot;&gt;
        &lt;input type=&quot;number&quot; id=&quot;value&quot; placeholder=&quot;Value&quot;&gt;
    
        &lt;button onclick=&quot;addRecord()&quot;&gt;Insert&lt;/button&gt;
        &lt;button onclick=&quot;updateRecord()&quot;&gt;Update&lt;/button&gt;
    &lt;/div&gt;
    
    &lt;h3&gt;Database Records&lt;/h3&gt;
    &lt;table id=&quot;data-table&quot;&gt;
        &lt;thead&gt;
            &lt;tr&gt;
                &lt;th&gt;ID&lt;/th&gt;
                &lt;th&gt;Category&lt;/th&gt;
                &lt;th&gt;Value&lt;/th&gt;
                &lt;th&gt;Actions&lt;/th&gt;
            &lt;/tr&gt;
        &lt;/thead&gt;
        &lt;tbody&gt;&lt;/tbody&gt;
    &lt;/table&gt;
    
    &lt;canvas id=&quot;barGraph&quot; width=&quot;600&quot; height=&quot;400&quot;&gt;&lt;/canvas&gt;
    
    &lt;script src=&quot;script.js&quot;&gt;&lt;/script&gt;


    The canvas element makes it possible to create a bar graph using plain code without any external libraries. Each bar is drawn based on the value stored in the database. This teaches beginners how to combine server side logic with a visual client side display.


    const tableBody = document.querySelector(&quot;#data-table tbody&quot;);
    const canvas = document.getElementById(&quot;barGraph&quot;);
    const ctx = canvas.getContext(&quot;2d&quot;);
    
    window.onload = loadData;
    
    function loadData() {
        fetch(&quot;fetch.php&quot;)
            .then(res =&gt; res.json())
            .then(data =&gt; {
                displayTable(data);
                drawGraph(data);
            });
    }
    
    function displayTable(data) {
        tableBody.innerHTML = &quot;&quot;;
    
        data.forEach(row =&gt; {
            let tr = document.createElement(&quot;tr&quot;);
            tr.innerHTML = `
                &lt;td&gt;${row.id}&lt;/td&gt;
                &lt;td&gt;${row.category}&lt;/td&gt;
                &lt;td&gt;${row.value}&lt;/td&gt;
                &lt;td&gt;
                    &lt;button onclick=&quot;fillForm(${row.id}, &#039;${row.category}&#039;, ${row.value})&quot;&gt;Edit&lt;/button&gt;
                    &lt;button onclick=&quot;deleteRecord(${row.id})&quot;&gt;Delete&lt;/button&gt;
                &lt;/td&gt;
            `;
            tableBody.appendChild(tr);
        });
    }
    
    function fillForm(id, category, value) {
        document.getElementById(&quot;id&quot;).value = id;
        document.getElementById(&quot;category&quot;).value = category;
        document.getElementById(&quot;value&quot;).value = value;
    }
    
    function addRecord() {
        const category = document.getElementById(&quot;category&quot;).value;
        const value = document.getElementById(&quot;value&quot;).value;
    
        fetch(&quot;insert.php&quot;, {
            method: &quot;POST&quot;,
            body: new URLSearchParams({ category, value })
        })
        .then(() =&gt; loadData());
    }
    
    function updateRecord() {
        const id = document.getElementById(&quot;id&quot;).value;
        const category = document.getElementById(&quot;category&quot;).value;
        const value = document.getElementById(&quot;value&quot;).value;
    
        fetch(&quot;update.php&quot;, {
            method: &quot;POST&quot;,
            body: new URLSearchParams({ id, category, value })
        })
        .then(() =&gt; loadData());
    }
    
    function deleteRecord(id) {
        fetch(&quot;delete.php&quot;, {
            method: &quot;POST&quot;,
            body: new URLSearchParams({ id })
        })
        .then(() =&gt; loadData());
    }
    
    function drawGraph(data) {
        ctx.clearRect(0, 0, canvas.width, canvas.height);
    
        let x = 50;
        const barWidth = 50;
    
        data.forEach(item =&gt; {
            const barHeight = item.value;
    
            ctx.fillStyle = &quot;#4CAF50&quot;;
            ctx.fillRect(x, canvas.height - barHeight, barWidth, barHeight);
    
            ctx.fillStyle = &quot;#000&quot;;
            ctx.fillText(item.category, x, canvas.height - barHeight - 10);
    
            x += barWidth + 20;
        });
    }


    Screenshots And Screencast

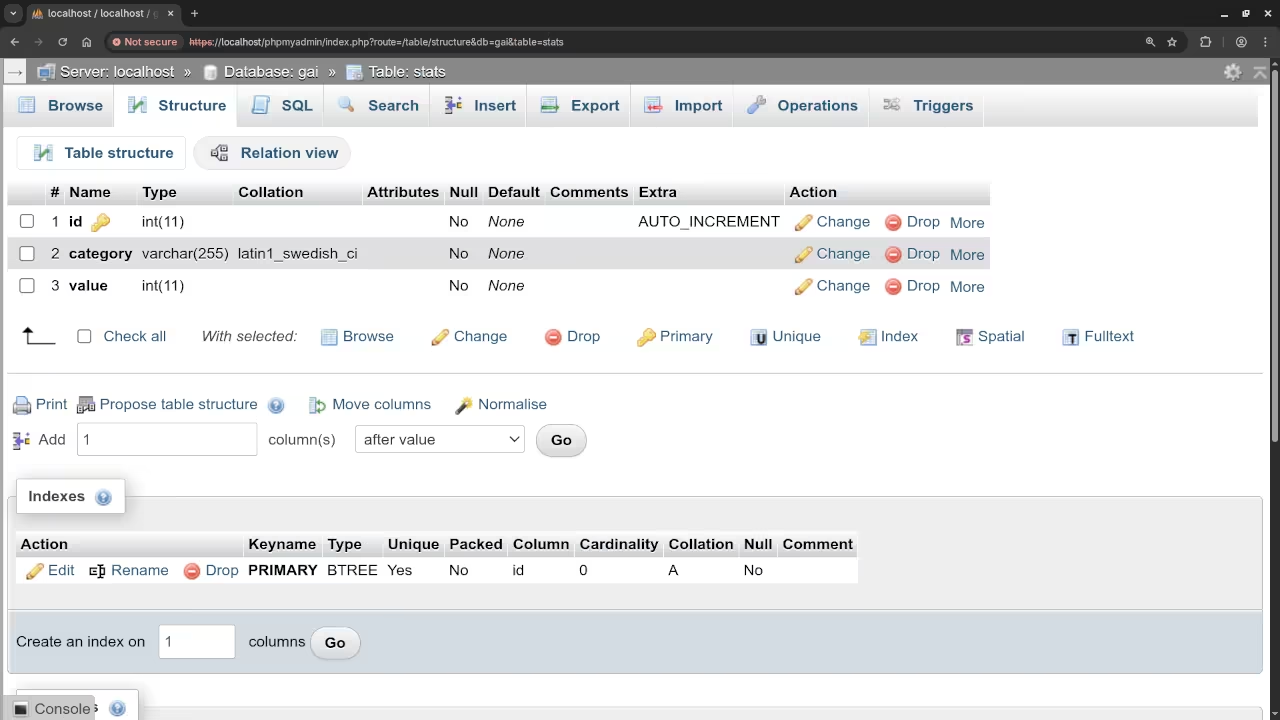
    Database Table
    Web Browser Displaying PHPMyAdmin Database Table for Stats

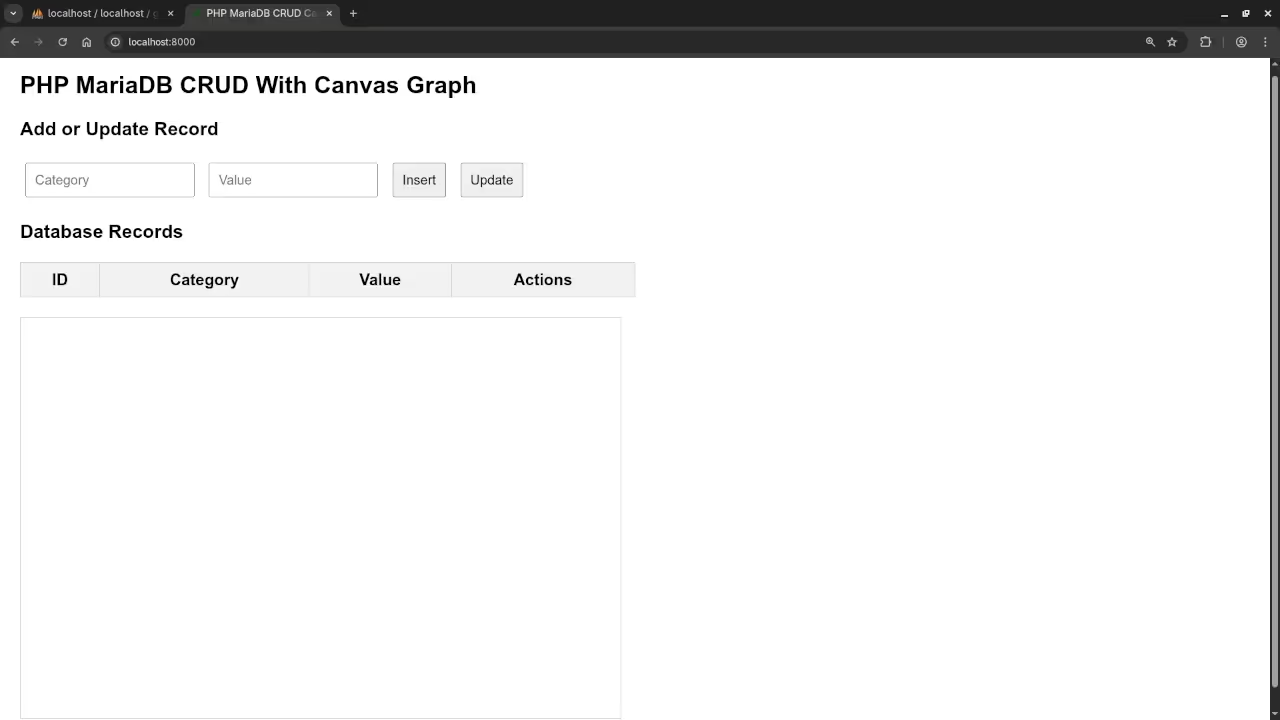
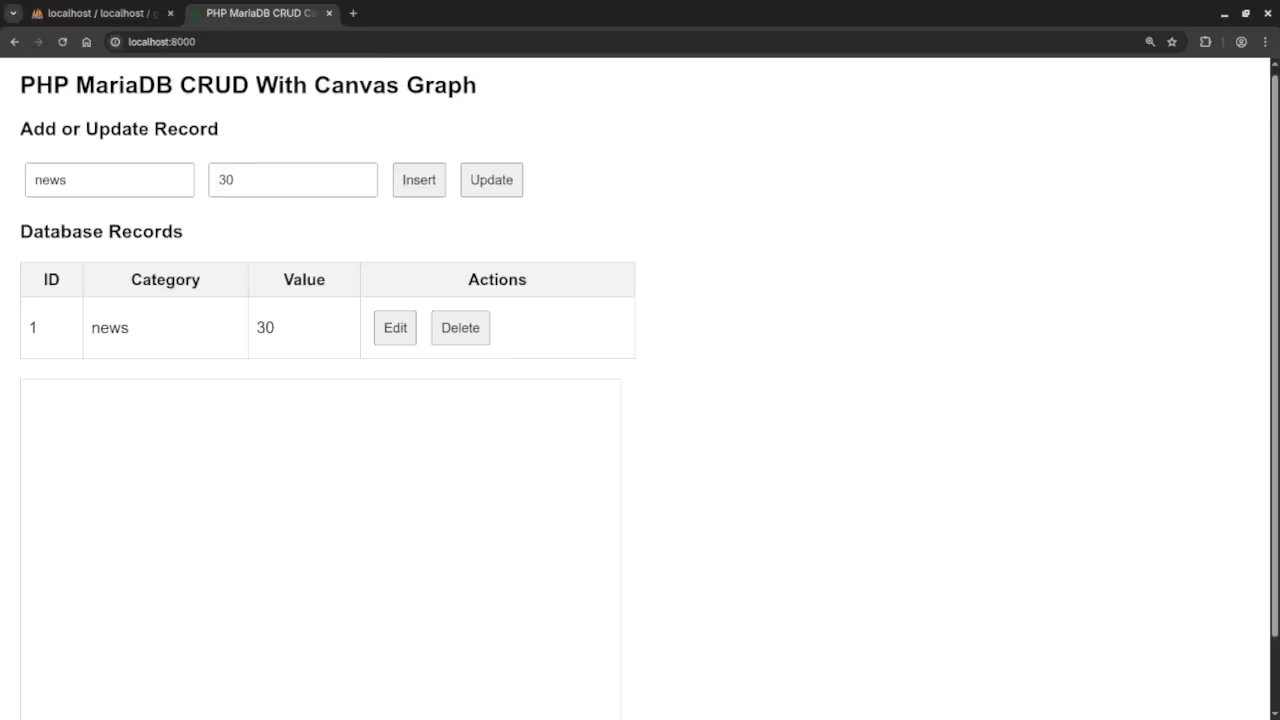
    Initial Application View
    Web Browser Displaying Zero Stats

    First Record View
    Web Browser Displaying Record From Stats

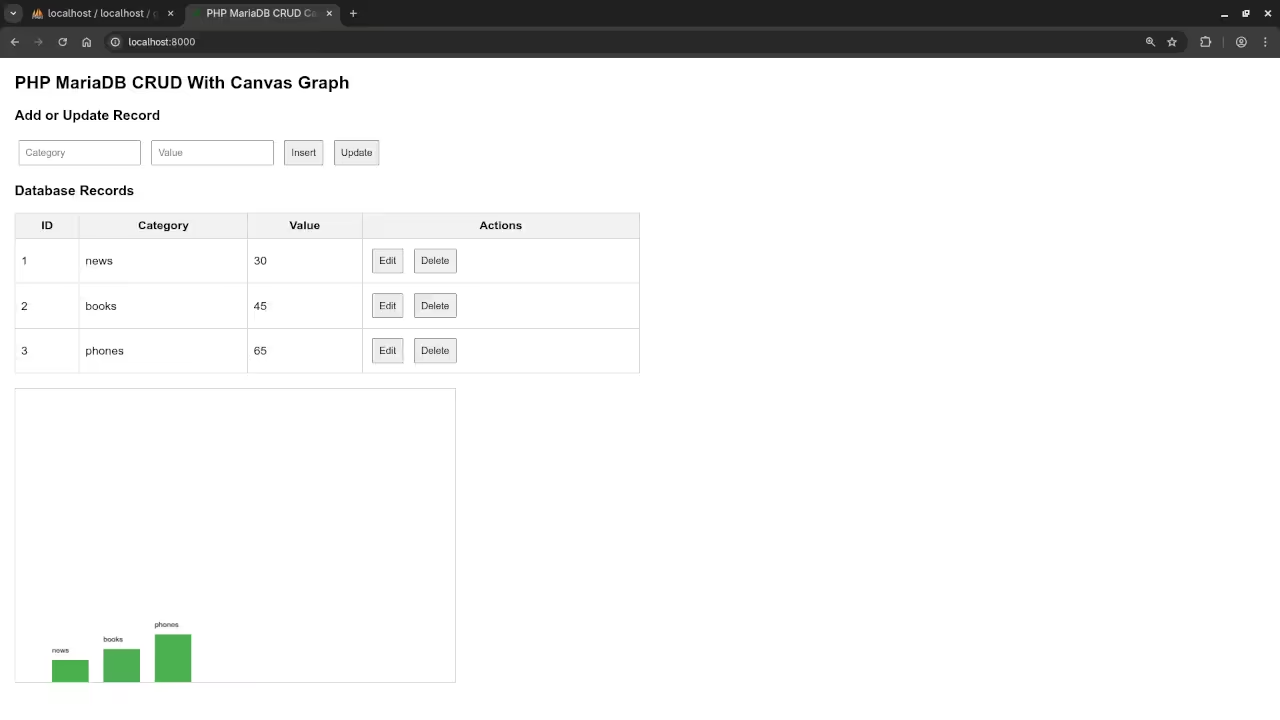
    Plotted View
    Web Browser Displaying Plots From Stats Table

    PHP Dynamically Plotted Bar Graphs Video

    Further Reading

    A detailed guide to PHP with many examples can be found in the book Learning PHP available at this link.

    PHP Course

    A complete learning path with structured lessons is available in the course Learning PHP at this course link.

    One On One Help

    If you need personal tutoring assistance with programming or help updating or migrating a framework you can reach me at this contact page.

    Final Thoughts

    Using PHP and MariaDB together with the HTML canvas is an excellent beginner project that teaches practical skills that apply to real applications. You can expand this setup into dashboards monitoring tools and admin panels as you grow your skills.

  • Build An HTML5 3D Bar Graph

    Build An HTML5 3D Bar Graph


    How to Create Stunning HTML5 3D Bar Graphs with JavaScript

    Introduction

    Creating 3D bar graphs can add a touch of interactivity and professionalism to your web projects. In this beginner friendly tutorial, we will walk through how to build a 3D bar graph using HTML5 and JavaScript. This approach leverages the canvas element, and with a bit of styling, you can bring your data to life in 3D. Lets get started!

    Step 1: Setting Up the HTML and Canvas

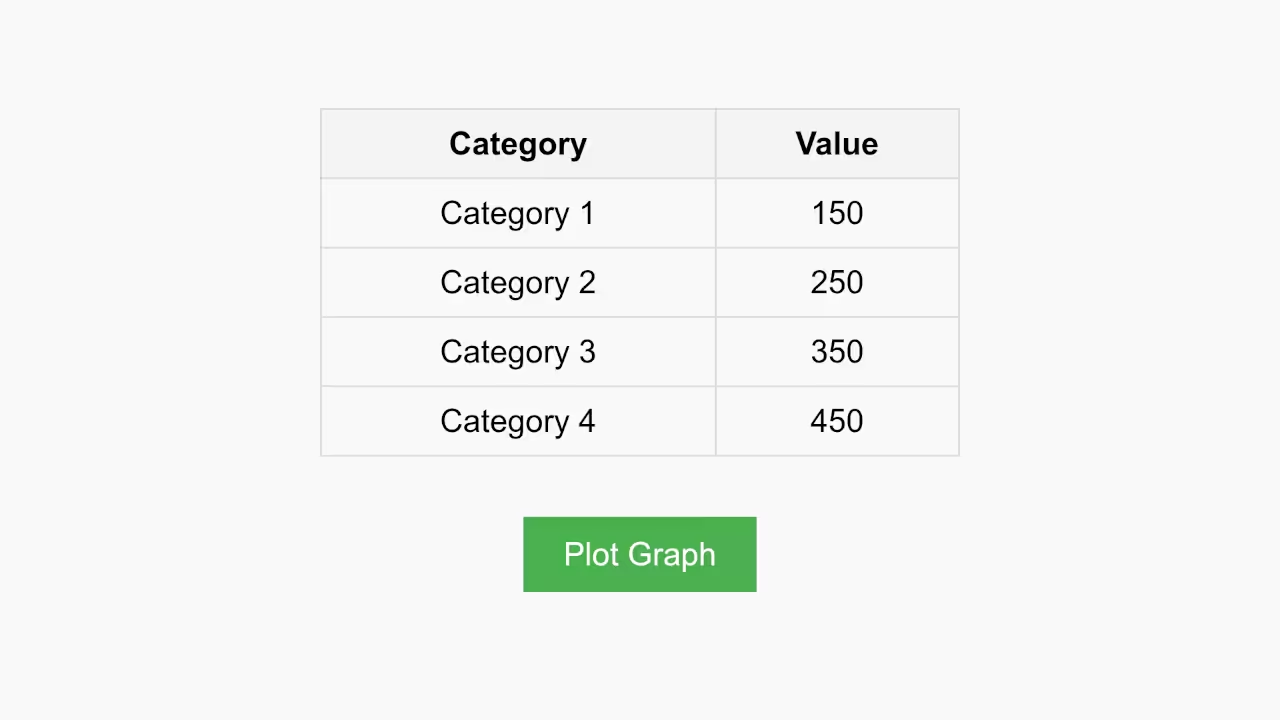
    Before we jump into the code, it is important to understand the basic structure. The graph will be drawn on an HTML5 <canvas> element, and we will fetch data directly from an HTML table.


       &lt;table id=&quot;data-table&quot;&gt;
          &lt;thead&gt;
             &lt;tr&gt;
                &lt;th&gt;Category&lt;/th&gt;
                &lt;th&gt;Value&lt;/th&gt;
             &lt;/tr&gt;
          &lt;/thead&gt;
          &lt;tbody&gt;
             &lt;tr&gt;
                &lt;td&gt;Category 1&lt;/td&gt;
                &lt;td&gt;150&lt;/td&gt;
             &lt;/tr&gt;
             &lt;tr&gt;
                &lt;td&gt;Category 2&lt;/td&gt;
                &lt;td&gt;250&lt;/td&gt;
             &lt;/tr&gt;
             &lt;tr&gt;
                &lt;td&gt;Category 3&lt;/td&gt;
                &lt;td&gt;350&lt;/td&gt;
             &lt;/tr&gt;
             &lt;tr&gt;
                &lt;td&gt;Category 4&lt;/td&gt;
                &lt;td&gt;450&lt;/td&gt;
             &lt;/tr&gt;
          &lt;/tbody&gt;
       &lt;/table&gt;
    
       &lt;canvas id=&quot;barGraph&quot; width=&quot;600&quot; height=&quot;400&quot;&gt;&lt;/canvas&gt;


    In this setup, we have a simple table with categories and values, and the canvas element where the graph will be drawn.

    Step 2: JavaScript for Drawing the 3D Bar Graph

    We will use JavaScript to draw the graph on the canvas. Here is the code that makes this possible:


       // JavaScript code for generating the 3D bar graph
       const canvas = document.getElementById(&#039;barGraph&#039;);
       const ctx = canvas.getContext(&#039;2d&#039;);
       const data = []; // Data for the graph
       const tableRows = document.querySelectorAll(&#039;#data-table tbody tr&#039;);
    
       // Fetch data from the table
       tableRows.forEach(row =&gt; {
       const category = row.cells[0].innerText;
       const value = parseInt(row.cells[1].innerText);
       data.push({ category, value });
       });
    
       // Bar properties and depth factor
       const barWidth = 50;
       const gap = 30;
       const depthFactor = 0.3; // Controls depth of the bars
    
       // Function to draw a 3D bar
       function draw3DBar(x, y, width, height, depth) {
       ctx.fillStyle = &#039;#4CAF50&#039;;
       ctx.beginPath();
       ctx.moveTo(x, y); // Bottom-left corner
       ctx.lineTo(x + width, y); // Bottom-right corner
       ctx.lineTo(x + width, y - height); // Top-right corner
       ctx.lineTo(x, y - height); // Top-left corner
       ctx.closePath();
       ctx.fill();
    
       ctx.fillStyle = &#039;#388E3C&#039;; // Right face
       ctx.beginPath();
       ctx.moveTo(x + width, y);
       ctx.lineTo(x + width + depth, y - depth);
       ctx.lineTo(x + width + depth, y - height - depth);
       ctx.lineTo(x + width, y - height);
       ctx.closePath();
       ctx.fill();
    
       ctx.fillStyle = &#039;#66BB6A&#039;; // Top face
       ctx.beginPath();
       ctx.moveTo(x, y - height);
       ctx.lineTo(x + width, y - height);
       ctx.lineTo(x + width + depth, y - height - depth);
       ctx.lineTo(x + depth, y - height - depth);
       ctx.closePath();
       ctx.fill();
       }
    
       // Function to draw the graph
       function drawGraph() {
       ctx.clearRect(0, 0, canvas.width, canvas.height); // Clear canvas
       let x = 100; // Starting x-position
       const baseY = canvas.height - 50; // Bottom of canvas
    
       data.forEach(item =&gt; {
       const barHeight = item.value;
       const depth = barHeight * depthFactor; // Adjust depth
       draw3DBar(x, baseY, barWidth, barHeight, depth);
       x += barWidth + gap; // Move x for next bar
       });
       }
    
       // Draw the graph
       drawGraph();


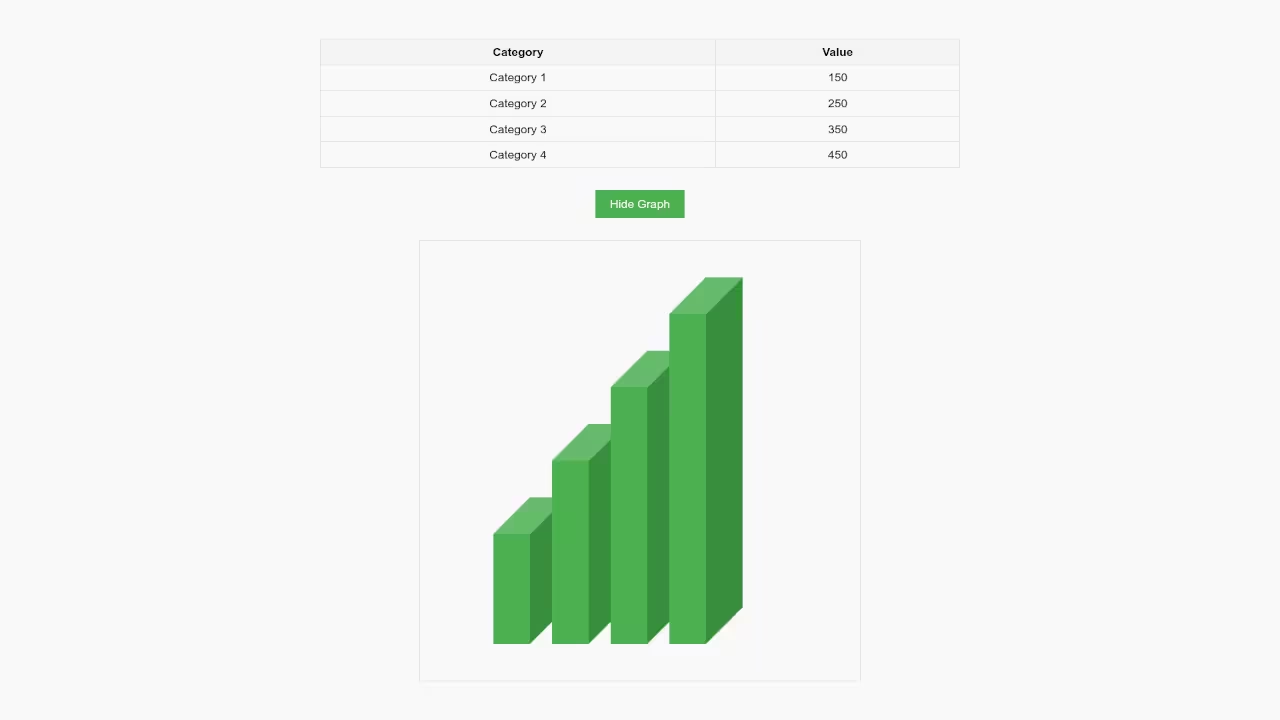
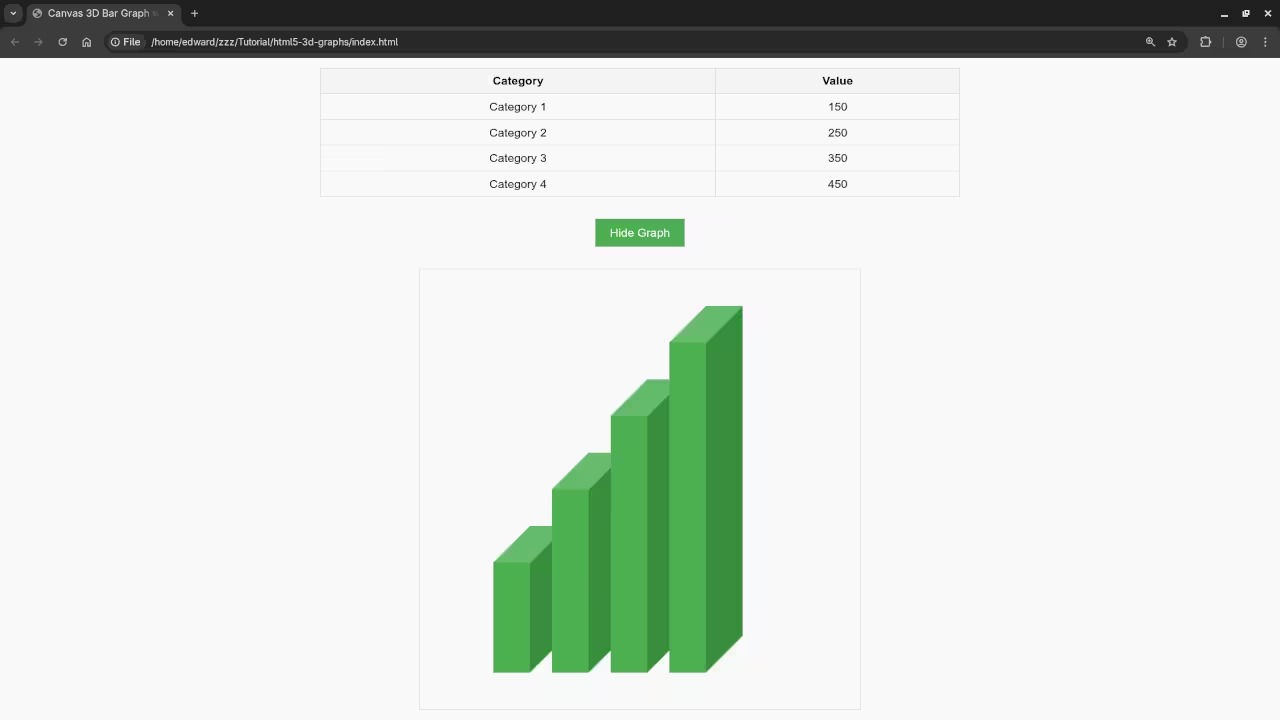
    In this code, we define a function draw3DBar that draws the 3D effect on each bar. We also loop through the table data to create bars of varying heights, and use depthFactor to control the depth.

    Step 3: Visualizing the 3D Effect

    This code will generate a simple 3D effect by using depth for each bar. The bars appear to pop out of the canvas, giving them a three dimensional look. You can experiment with the depthFactor to adjust how deep the bars appear.

    Consolidated Demo

    HTML5 3D Bar Graph Demo

    Screenshot

    HTML5 Plot Graph Button
    Web Browser Showing HTML5 Plot 3D Graph Button

    HTML5 3D Bar Graph
    Web Browser Showing HTML5 Plotted 3D Bar Graph

    Live Screencast

    Screencast Of HTML5 3D Bar Graph Plotter

    Additional Resources

    If you want to deepen your knowledge of JavaScript, I have written a book titled Learning JavaScript that covers the fundamentals and will help you build a solid foundation in programming. You can grab a copy here: Learning JavaScript on Amazon.

    Additionally, I have created an online course called Learning JavaScript, where I take you through JavaScript from beginner to intermediate level with hands on exercises and examples. You can check it out here: Learning JavaScript Course.

    Lastly, if you need one on one programming tutorials, I am available to help you with JavaScript or any other programming topic. Feel free to reach out to me: Contact for One on One Tutorials.

    Conclusion

    Creating 3D bar graphs with HTML5 and JavaScript is a fun and interactive way to visualize data on the web. By using the canvas element and manipulating it with JavaScript, you can create dynamic, engaging visualizations that look great on any website.