Beginner Guide to PHP MariaDB and Dynamic Canvas Plotting with CRUD
This guide introduces a simple way for beginners to use PHP with MariaDB to create a basic data system that can add update delete and display information as a live canvas graph in the browser. The approach is light easy to follow and does not require any advanced tools or frameworks.
What This Guide Covers
You will learn how to build a MariaDB table and connect it to PHP so you can create update and remove records. You will also learn how to fetch the data in JSON format and use plain JavaScript to draw a bar graph with the HTML canvas element. The graph updates automatically whenever the database changes.
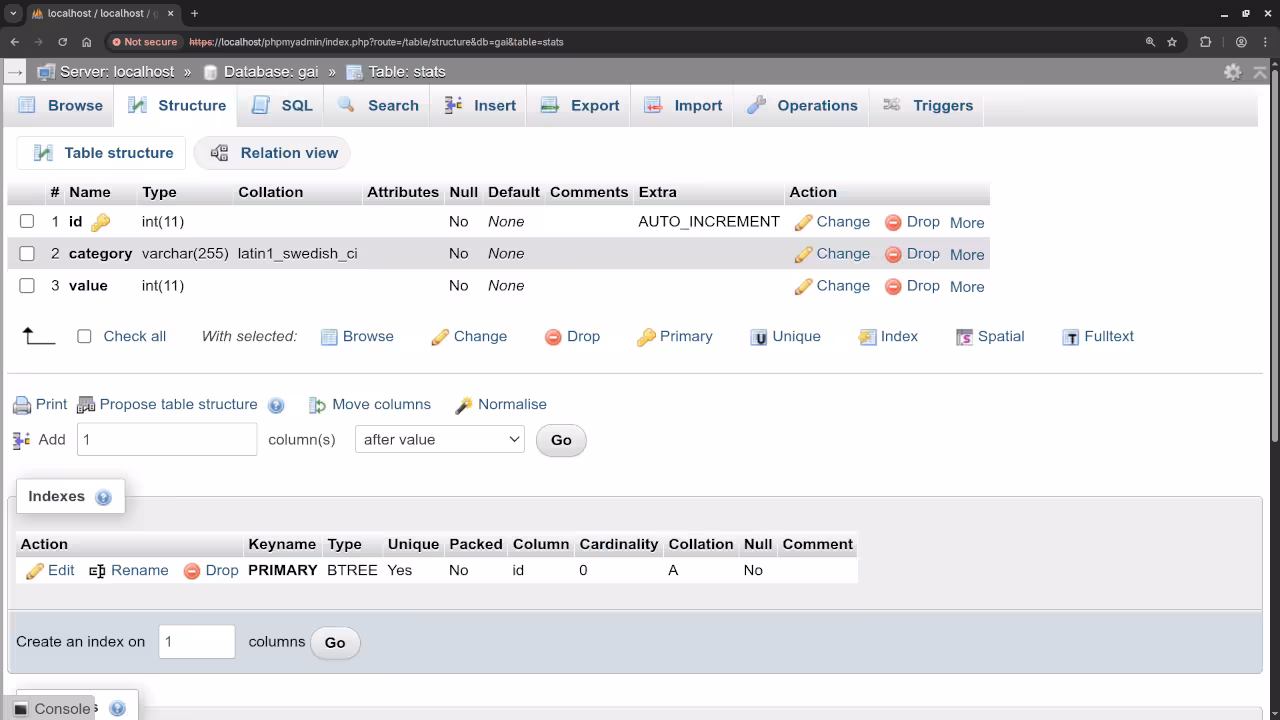
Creating the MariaDB Table
Start by creating a table to store a category and a number value for each record. This keeps the structure simple and easy for beginners to understand. The table will store an id a text label and a number that you will later plot on the canvas.
CREATE TABLE stats (
id INT AUTO_INCREMENT PRIMARY KEY,
category VARCHAR(255) NOT NULL,
value INT NOT NULL
);
Using PHP for Basic Data Operations
$host = "localhost";
$dbname = "testdb";
$username = "root";
$password = "";
try {
$pdo = new PDO("mysql:host=$host;dbname=$dbname", $username, $password);
$pdo->setAttribute(PDO::ATTR_ERRMODE, PDO::ERRMODE_EXCEPTION);
} catch (PDOException $e) {
die("Database Connection Failed: " . $e->getMessage());
}
PHP will handle the tasks that communicate with the database. You will create one script to add data one script to update data one script to delete data and one script to fetch all the data so your browser can show it. Each file uses clear steps that a beginner can read and understand without difficulty.
Fetching Data for the Graph
include 'db.php';
$stmt = $pdo->query("SELECT * FROM stats ORDER BY id ASC");
$data = $stmt->fetchAll(PDO::FETCH_ASSOC);
echo json_encode($data);
Insert Script
include 'db.php';
$category = $_POST['category'];
$value = $_POST['value'];
$stmt = $pdo->prepare("INSERT INTO stats (category, value) VALUES (?, ?)");
$stmt->execute([$category, $value]);
echo "Inserted";
Update Script
include 'db.php';
$id = $_POST['id'];
$category = $_POST['category'];
$value = $_POST['value'];
$stmt = $pdo->prepare("UPDATE stats SET category = ?, value = ? WHERE id = ?");
$stmt->execute([$category, $value, $id]);
echo "Updated";
Delete Script
include 'db.php';
$id = $_POST['id'];
$stmt = $pdo->prepare("DELETE FROM stats WHERE id = ?");
$stmt->execute([$id]);
echo "Deleted";
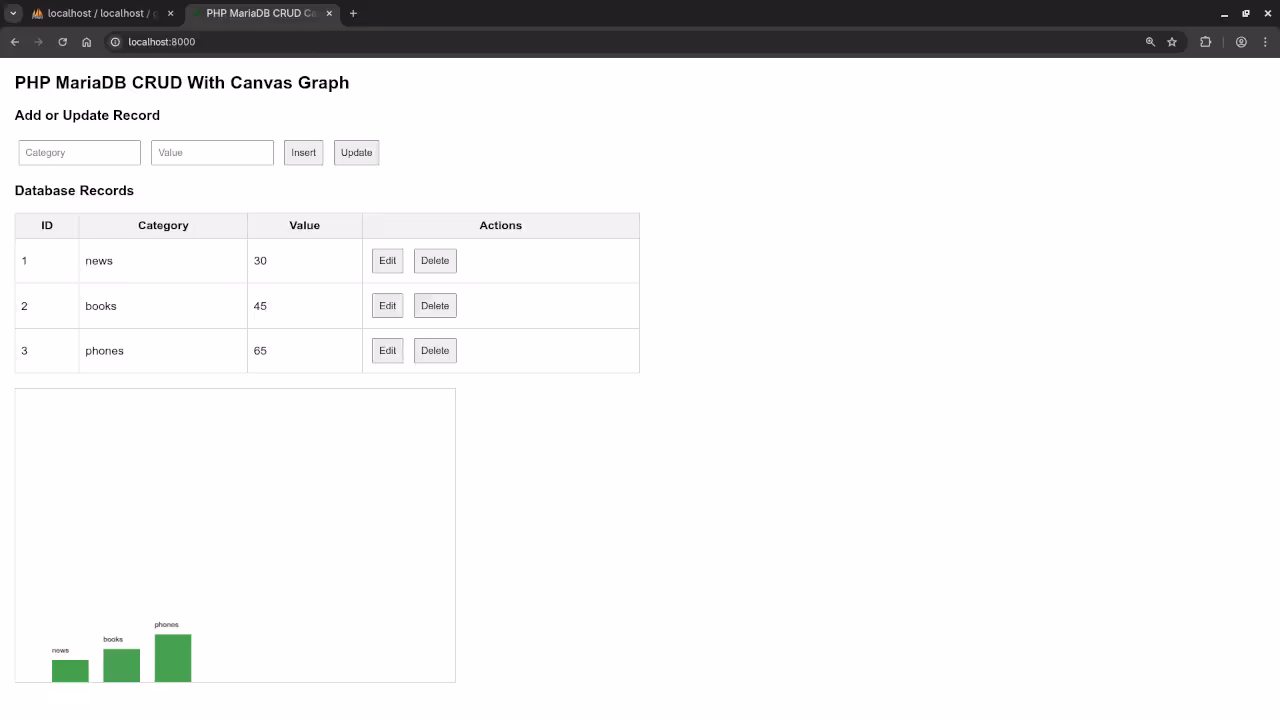
Your JavaScript code will request the data from the PHP fetch script then read each record and draw a bar for it on the canvas. The drawing process uses the rectangle function of the canvas context and places each bar at regular spacing across the chart area. When the data changes the chart is redrawn so the viewer always sees the latest values.
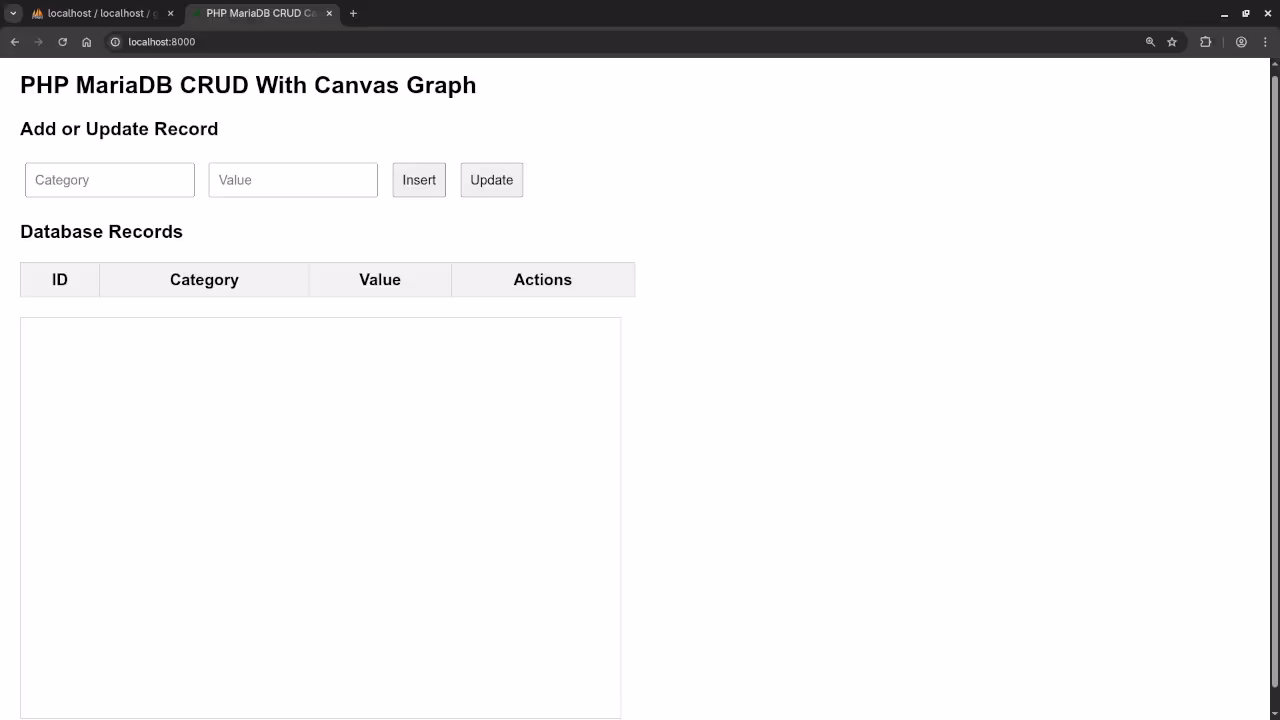
Drawing the Canvas Graph
<div>
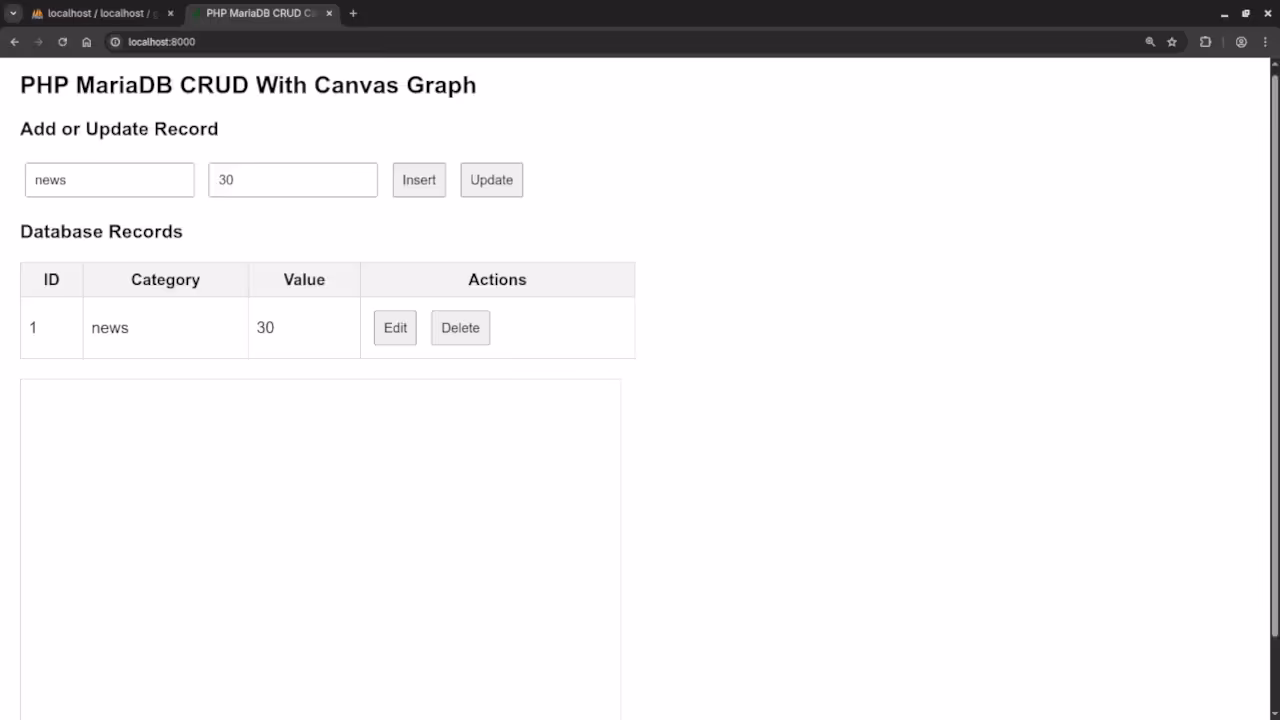
<h3>Add or Update Record</h3>
<input type="hidden" id="id">
<input type="text" id="category" placeholder="Category">
<input type="number" id="value" placeholder="Value">
<button onclick="addRecord()">Insert</button>
<button onclick="updateRecord()">Update</button>
</div>
<h3>Database Records</h3>
<table id="data-table">
<thead>
<tr>
<th>ID</th>
<th>Category</th>
<th>Value</th>
<th>Actions</th>
</tr>
</thead>
<tbody></tbody>
</table>
<canvas id="barGraph" width="600" height="400"></canvas>
<script src="script.js"></script>
The canvas element makes it possible to create a bar graph using plain code without any external libraries. Each bar is drawn based on the value stored in the database. This teaches beginners how to combine server side logic with a visual client side display.
const tableBody = document.querySelector("#data-table tbody");
const canvas = document.getElementById("barGraph");
const ctx = canvas.getContext("2d");
window.onload = loadData;
function loadData() {
fetch("fetch.php")
.then(res => res.json())
.then(data => {
displayTable(data);
drawGraph(data);
});
}
function displayTable(data) {
tableBody.innerHTML = "";
data.forEach(row => {
let tr = document.createElement("tr");
tr.innerHTML = `
<td>${row.id}</td>
<td>${row.category}</td>
<td>${row.value}</td>
<td>
<button onclick="fillForm(${row.id}, '${row.category}', ${row.value})">Edit</button>
<button onclick="deleteRecord(${row.id})">Delete</button>
</td>
`;
tableBody.appendChild(tr);
});
}
function fillForm(id, category, value) {
document.getElementById("id").value = id;
document.getElementById("category").value = category;
document.getElementById("value").value = value;
}
function addRecord() {
const category = document.getElementById("category").value;
const value = document.getElementById("value").value;
fetch("insert.php", {
method: "POST",
body: new URLSearchParams({ category, value })
})
.then(() => loadData());
}
function updateRecord() {
const id = document.getElementById("id").value;
const category = document.getElementById("category").value;
const value = document.getElementById("value").value;
fetch("update.php", {
method: "POST",
body: new URLSearchParams({ id, category, value })
})
.then(() => loadData());
}
function deleteRecord(id) {
fetch("delete.php", {
method: "POST",
body: new URLSearchParams({ id })
})
.then(() => loadData());
}
function drawGraph(data) {
ctx.clearRect(0, 0, canvas.width, canvas.height);
let x = 50;
const barWidth = 50;
data.forEach(item => {
const barHeight = item.value;
ctx.fillStyle = "#4CAF50";
ctx.fillRect(x, canvas.height - barHeight, barWidth, barHeight);
ctx.fillStyle = "#000";
ctx.fillText(item.category, x, canvas.height - barHeight - 10);
x += barWidth + 20;
});
}
Screenshots And Screencast
Further Reading
A detailed guide to PHP with many examples can be found in the book Learning PHP available at this link.
PHP Course
A complete learning path with structured lessons is available in the course Learning PHP at this course link.
One On One Help
If you need personal tutoring assistance with programming or help updating or migrating a framework you can reach me at this contact page.
Final Thoughts
Using PHP and MariaDB together with the HTML canvas is an excellent beginner project that teaches practical skills that apply to real applications. You can expand this setup into dashboards monitoring tools and admin panels as you grow your skills.
🚀 Recommended Resources
Disclosure: Some of the links above are referral links. I may earn a commission if you make a purchase at no extra cost to you.