AI image generation is changing fast for Linux users. You can now run Flux.2 Klein locally today.
High Performance Hardware For AI
The AMD Instinct MI60 is a powerful server GPU. It features 32GB of high speed HBM2 memory.
Fedora 43 provides the best environment for this task. It includes the latest ROCm 6.4 software stack.
Modern Transformer Models
Flux.2 Klein is a very fast transformer model. It unifies image generation and editing in one tool.
The model fits perfectly into the MI60 memory. Using GGUF quantization helps maintain high output quality.
Open Source Licensing Benefits
The stable-diffusion.cpp application uses the MIT license. This open source license allows for total freedom.
You can modify and distribute the software easily. There are no hidden fees for commercial usage.
Open source code ensures your privacy remains safe. You can verify how your data is processed locally.
Compiling On Fedora 43 With ROCm
Compiling for AMD GPUs is a straightforward process. First you must install the hipblas-devel system packages.
Use the dnf command to install development tools. You also need the git and cmake packages.
Building From Source
Clone the stable-diffusion.cpp repository from the web. Create a new build directory inside the folder.
Run the cmake command with the HIP option. Set the SD_HIPBLAS flag to the ON position.
Target the gfx906 architecture for the MI60 GPU. This matches the specific hardware version of your card.
Start the compilation process using the make command. Use multiple processor cores to speed up the build.
Performance And Hardware Optimization
The MI60 lacks modern matrix cores for AI. However the 1TB per second bandwidth is amazing.
This bandwidth allows Flux.2 Klein to generate images quickly. You can create high resolution art in seconds.
The C++ code runs much faster than Python. It removes heavy dependencies for a lightweight local setup.
Always monitor your hardware temperatures during heavy generation. The MI60 requires active cooling for long sessions.
Licensing and Commercial Use
The FLUX.2 [klein] 4B model is released under the Apache 2.0 License, which is a significant departure from the more restrictive “Non-Commercial” licenses found on the larger 9B and 32B models. This permissive license means you are legally free to use the 4B model for commercial purposes, including building paid applications, generating marketing assets for clients, or integrating the model into a business workflow without paying royalties. You are also encouraged to modify the weights, train custom LoRAs, or redistribute the model, provided you include the original license and copyright notice.
Tips for Best Results
To get the most out of the Klein 4B architecture, shift away from “tag-based” prompting and adopt a prose-style approach. Describe your scene as if you are writing a brief passage in a novel; the model is highly sensitive to word order, so place your primary subject at the beginning. Additionally, FLUX.2 [klein] excels at following hex color codes and rendering exact text placed within single quotes.
On the technical side, aim for 4 to 6 inference steps for the Distilled version. Increasing the step count beyond 10 often degrades quality. Keep your Guidance Scale (CFG) low—around 1.0 for Distilled and 3.5 to 5.0 for the Base model. Finally, ensure you are using the specific Klein VAE and the Qwen3-4B text encoder to avoid tensor shape mismatch errors during loading.
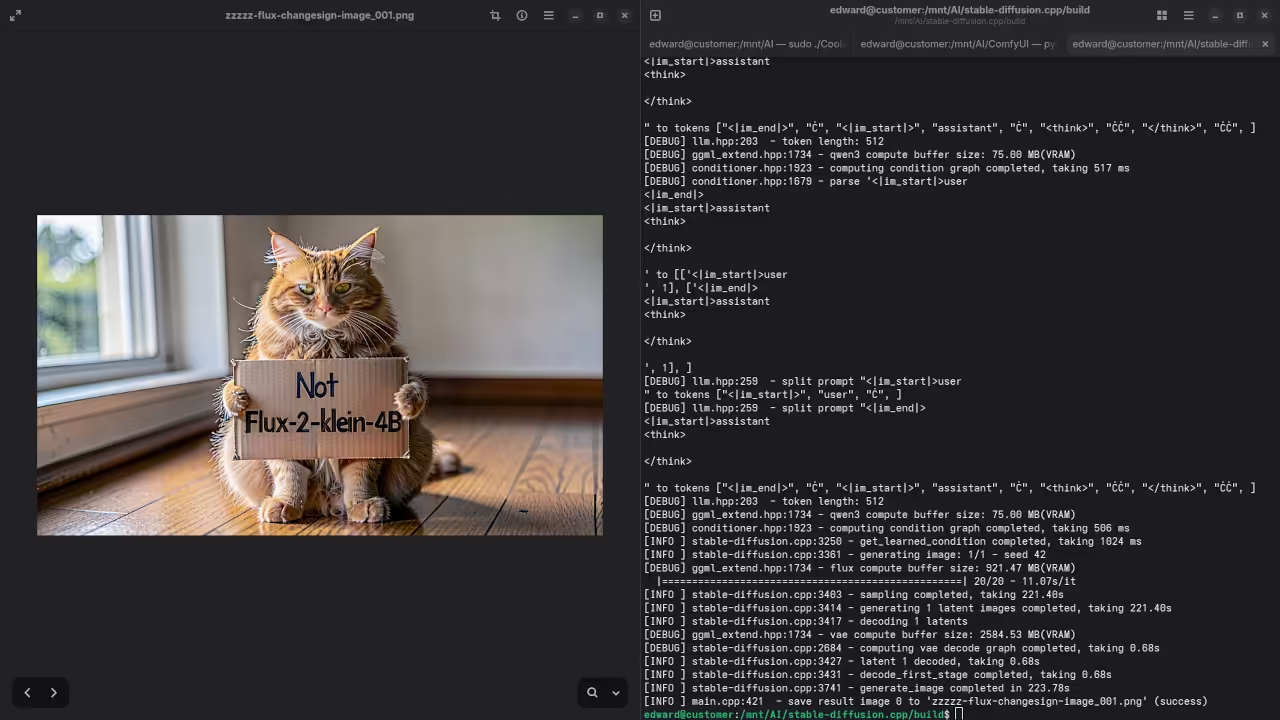
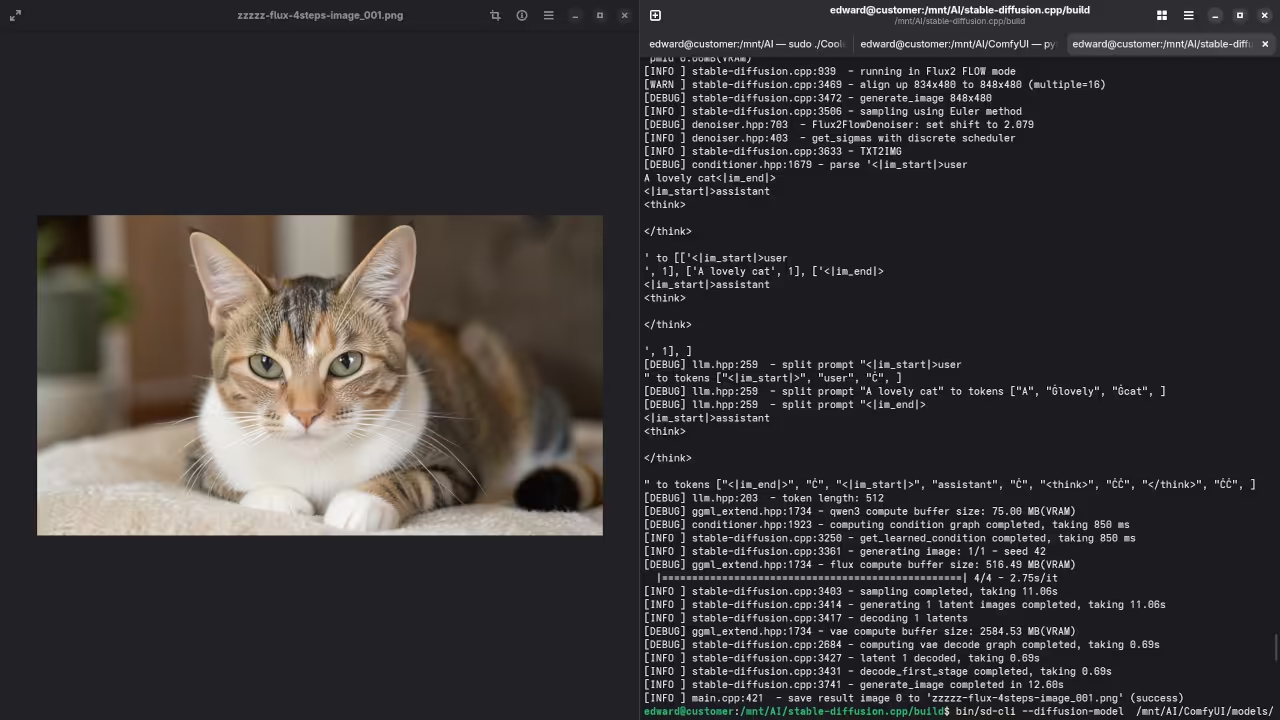
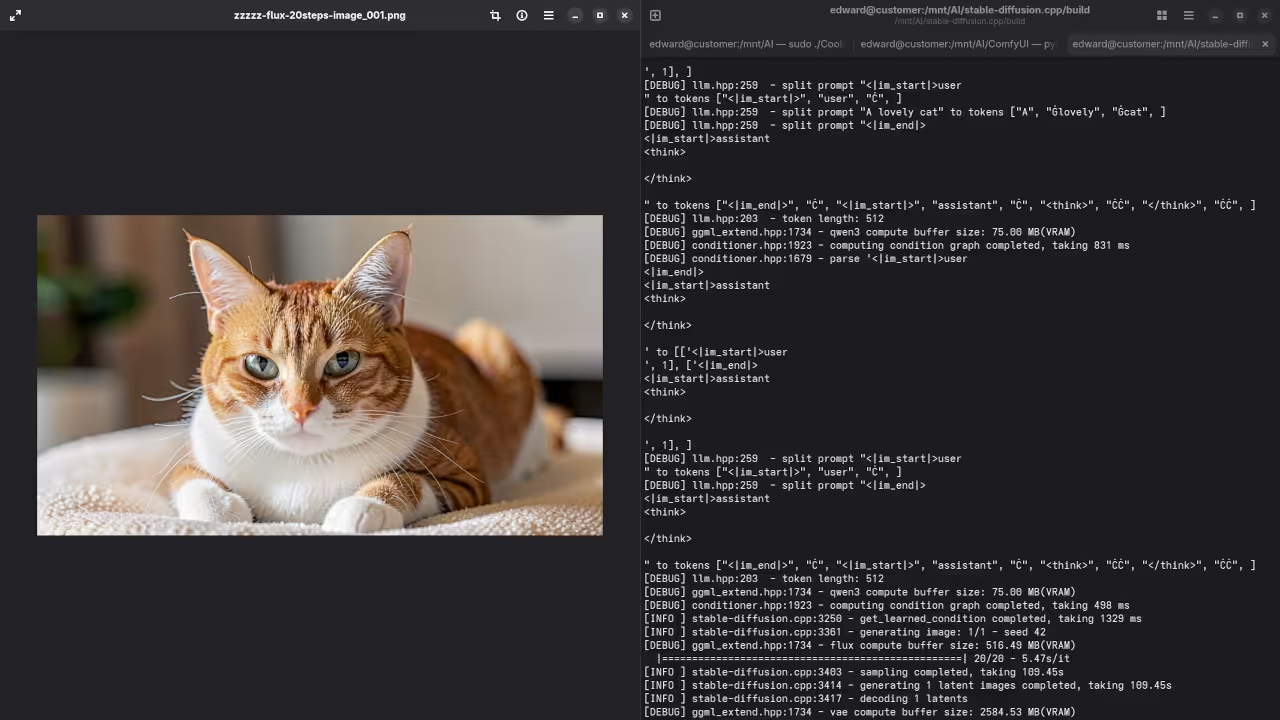
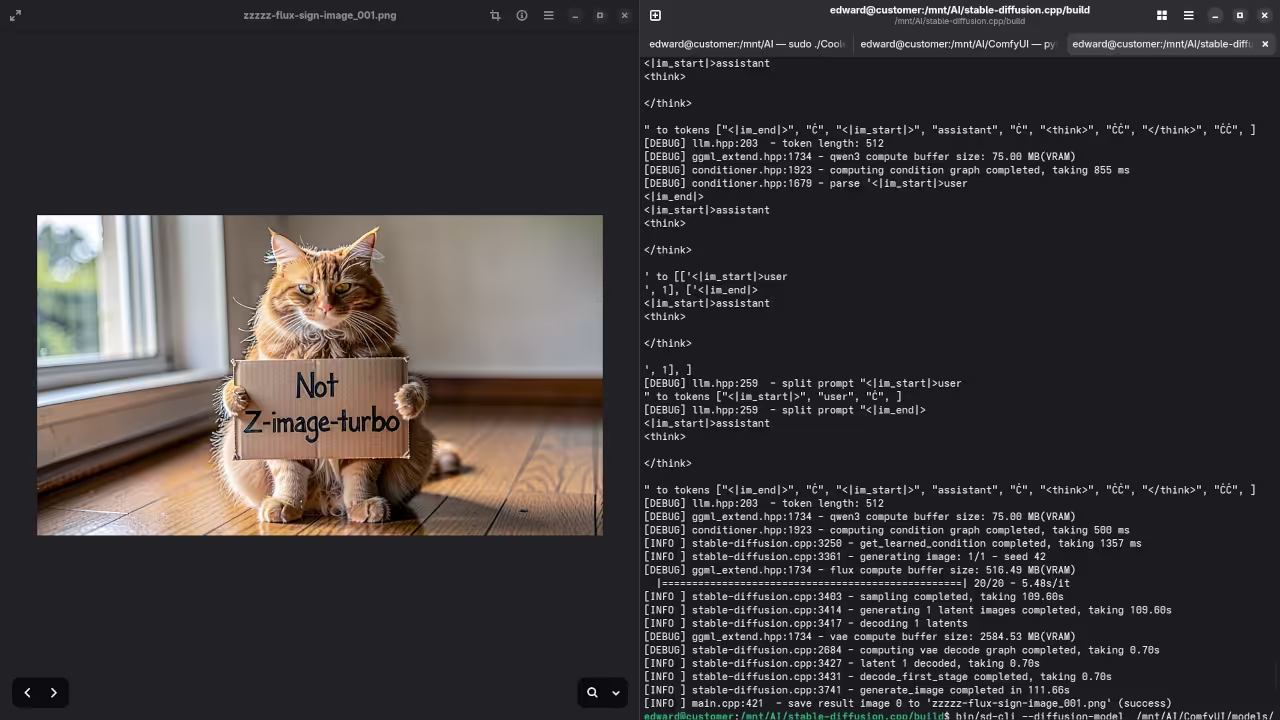
Screenshot
4 Steps Flux.2-klein-4B Results From stable-diffusion.cpp20 Steps Flux.2-klein-4B Results From stable-diffusion.cppSign Holding Flux.2-klein-4B Results From stable-diffusion.cpp
Live Screencast
Screencast Of AI Generated Images Using Flux.2-klein-4B And stable-diffusion.cpp On AMD GPUAddedum Fixing AI Black Images Using Flex.2-Klein And stable-diffusion.cpp
Learn to build 3D charts with Python. Fedora Linux makes this process very smooth.
Getting Started on Fedora Linux
First install Blender on your Fedora system. Use the dnf command in your terminal.
Using the Blender Python API
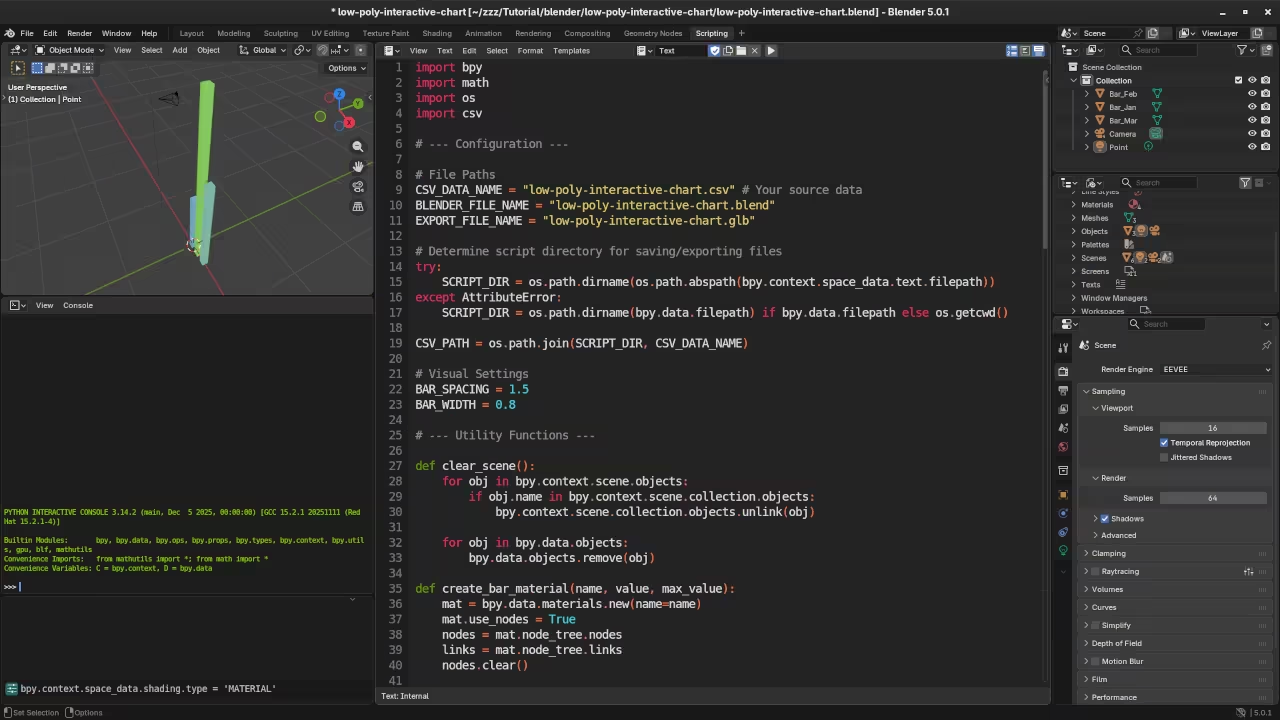
Blender features a powerful Python scripting environment. This API automates every 3D modeling step.
Create a CSV file for your chart data. Save it inside your main project folder.
import bpy
import csv
import os
# --- CONFIGURATION ---
CSV_FILE_PATH = "path/to/your/data.csv" # Update this!
EXPORT_PATH = "path/to/your/chart.glb"
GAP = 1.5 # Space between bars
def create_bar(name, value, index):
# Create a cube
bpy.ops.mesh.primitive_cube_add(size=1)
bar = bpy.context.active_object
bar.name = name
# Scale and position (Blender cubes are 2 units tall by default)
bar.scale = (0.5, 0.5, value / 2)
bar.location = (index * GAP, 0, value / 2)
# Create Material
mat = bpy.data.materials.new(name=f"Mat_{name}")
mat.use_nodes = True
nodes = mat.node_tree.nodes
# Set color based on height (Simple Green to Red logic)
color_node = nodes.get("Principled BSDF")
color_node.inputs[0].default_value = (value/10, 0.1, 0.8, 1)
bar.data.materials.append(mat)
def generate_chart():
# Clear existing objects
bpy.ops.object.select_all(action='SELECT')
bpy.ops.object.delete()
with open(CSV_FILE_PATH, mode='r') as f:
reader = csv.DictReader(f)
for i, row in enumerate(reader):
label = row['Label']
val = float(row['Value'])
create_bar(label, val, i)
# Export to GLB for Web
bpy.ops.export_scene.gltf(filepath=EXPORT_PATH, export_format='GLB')
print(f"Chart exported to {EXPORT_PATH}")
if __name__ == "__main__":
generate_chart()
Data Processing and Mesh Generation
The script reads your specific data values. It creates a unique bar for each.
Height scales automatically based on your numbers. Materials change color to reflect different values.
<script type="importmap">
{
"imports": {
"three": "https://unpkg.com/three@0.160.0/build/three.module.js",
"three/addons/": "https://unpkg.com/three@0.160.0/examples/jsm/"
}
}
</script>
<script type="module">
import * as THREE from 'three';
import { OrbitControls } from 'three/addons/controls/OrbitControls.js';
import { GLTFLoader } from 'three/addons/loaders/GLTFLoader.js';
import { EXRLoader } from 'three/addons/loaders/EXRLoader.js';
let scene, camera, renderer, controls;
init();
function init() {
// 1. Scene & Camera
scene = new THREE.Scene();
camera = new THREE.PerspectiveCamera(75, window.innerWidth / window.innerHeight, 0.1, 1000);
camera.position.set(5, 5, 10);
// 2. Renderer Setup
renderer = new THREE.WebGLRenderer({ antialias: true });
renderer.setPixelRatio(window.devicePixelRatio);
renderer.setSize(window.innerWidth, window.innerHeight);
renderer.toneMapping = THREE.ReinhardToneMapping; // Better for HDR/EXR
renderer.toneMappingExposure = 1.0;
document.body.appendChild(renderer.domElement);
// 3. Orbit Controls
controls = new OrbitControls(camera, renderer.domElement);
controls.enableDamping = true;
// 4. Load EXR Environment Map
new EXRLoader()
.load('courtyard.exr', function (texture) {
texture.mapping = THREE.EquirectangularReflectionMapping;
scene.background = texture;
scene.environment = texture; // This provides the lighting
// 5. Load the Blender GLB Chart
const loader = new GLTFLoader();
loader.load('interactive_chart.glb', function (gltf) {
scene.add(gltf.scene);
// Center the model based on its bounding box
const box = new THREE.Box3().setFromObject(gltf.scene);
const center = box.getCenter(new THREE.Vector3());
gltf.scene.position.x += (gltf.scene.position.x - center.x);
animate();
}, undefined, function (error) {
console.error('Error loading GLB:', error);
});
});
window.addEventListener('resize', onWindowResize);
}
function onWindowResize() {
camera.aspect = window.innerWidth / window.innerHeight;
camera.updateProjectionMatrix();
renderer.setSize(window.innerWidth, window.innerHeight);
}
function animate() {
requestAnimationFrame(animate);
controls.update();
renderer.render(scene, camera);
}
</script>
Exporting for Web Deployment
Export the final scene to a GLB file. ThreeJS displays the 3D model online.
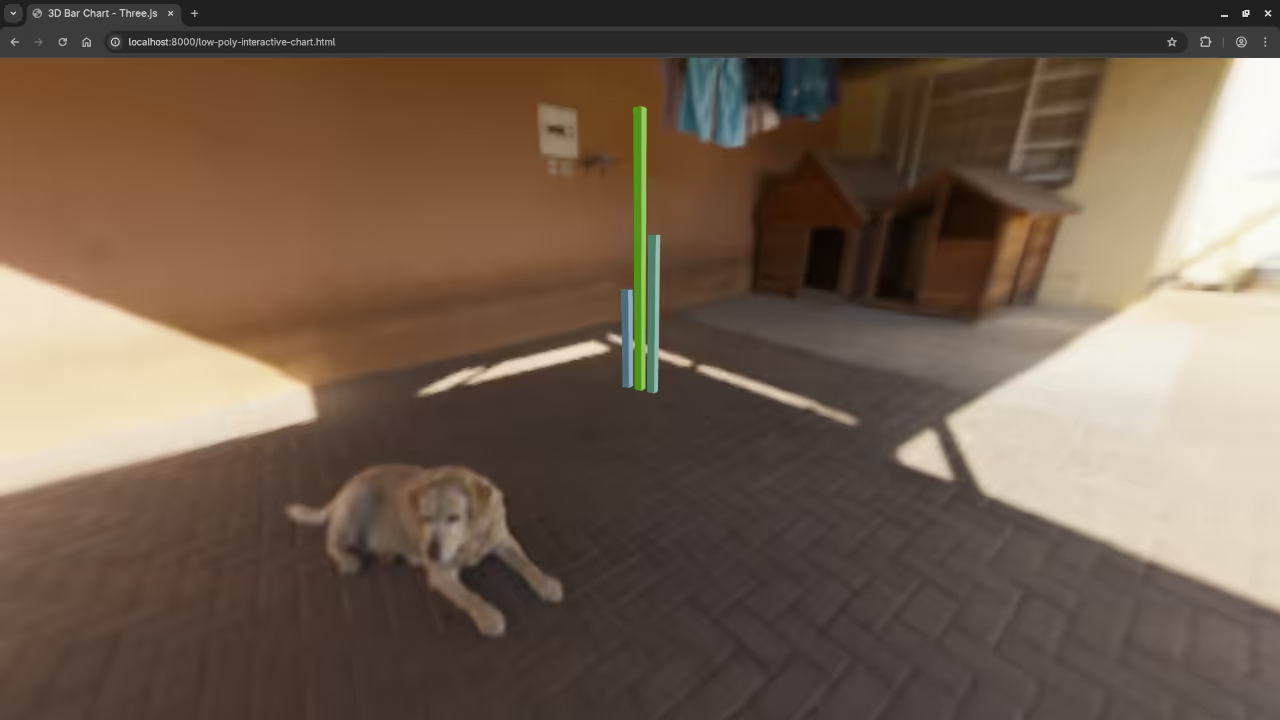
Add a courtyard EXR for natural lighting. This makes your web chart look realistic.
📸 Screenshots & Screencast
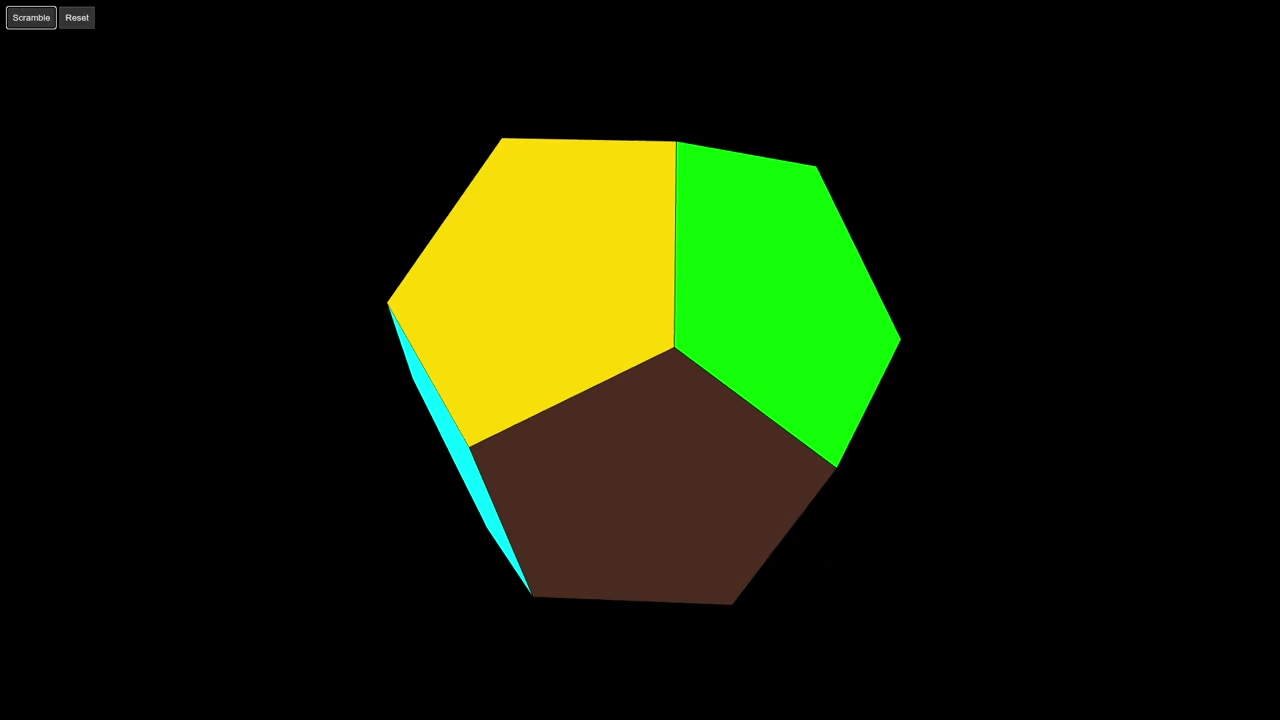
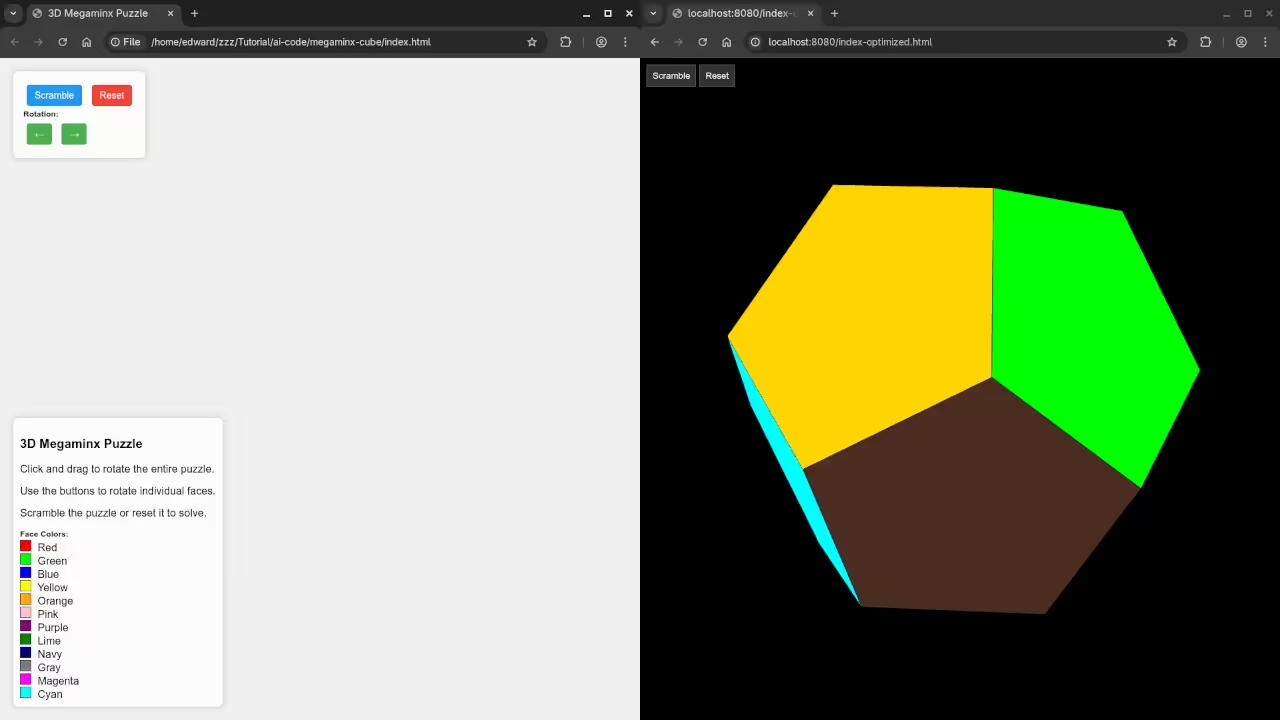
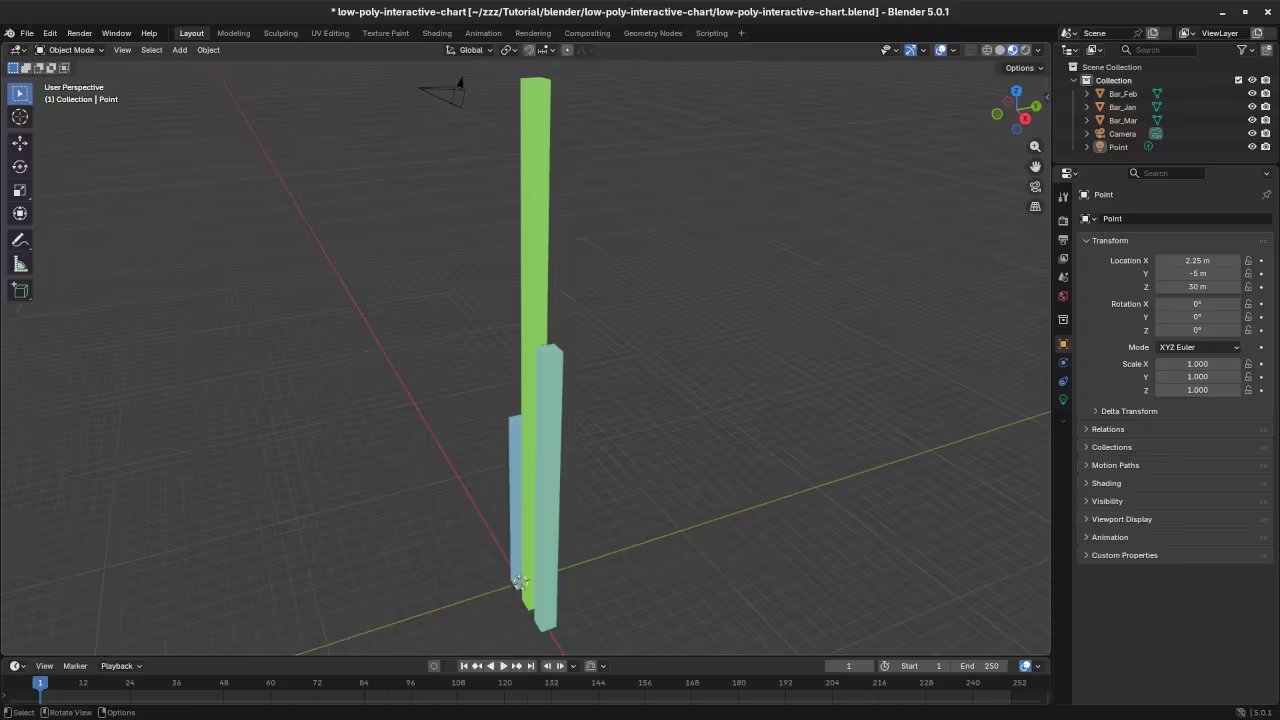
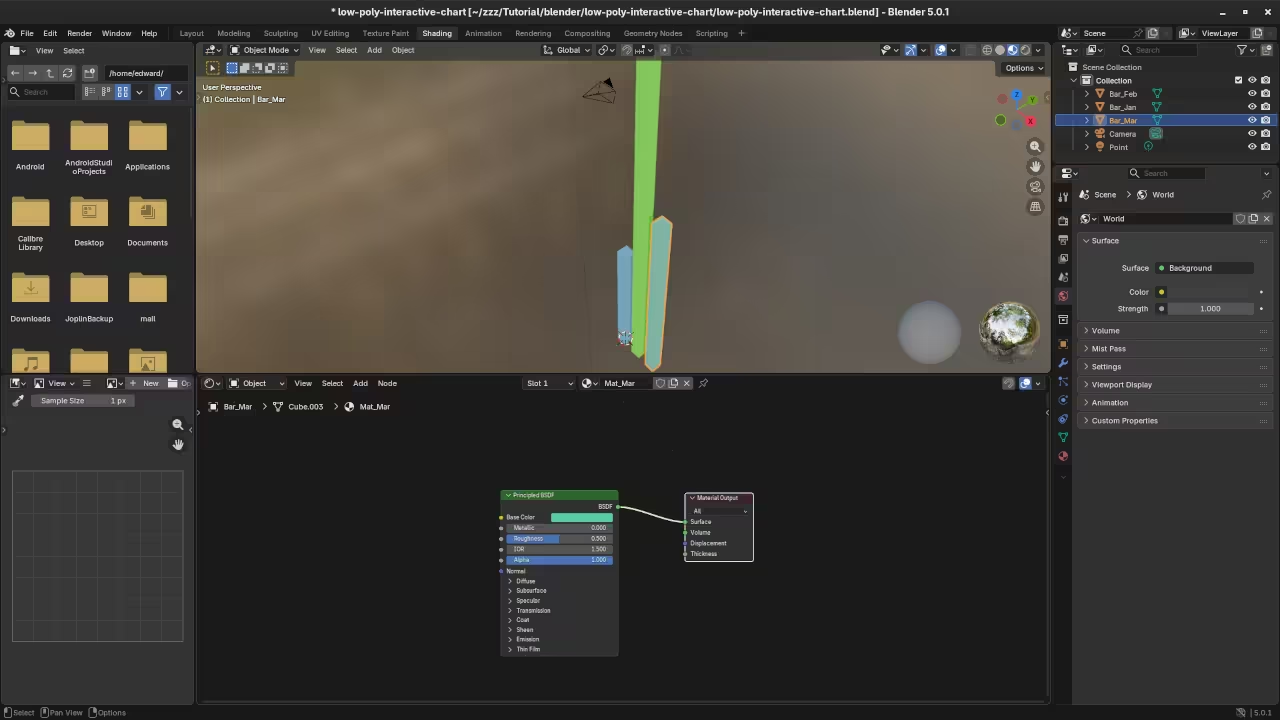
Blender Scripting Workspace Displaying 3D Web Charts Python CodeBlender Layout Workspace Displaying 3D Web ChartsBlender Shading Workspace Displaying 3D Web ChartsWeb Browser Displaying Rendered 3D Web ChartsScreencast For Blender Python API 3D Web Charts
Nushell is a new type of shell for programmers. It treats all your data as structured tables.
Structured Data Versus Plain Text
Most shells like Bash only use plain text strings. Nushell understands columns and rows like a database.
Installing Nushell on Fedora Linux is very simple today. Use the dnf command to grab the latest version.
Cross Platform Compatibility and Installation
The shell works perfectly on Windows and macOS too. This makes it a great cross platform choice.
Type ls to see a beautiful colored table. You can filter files easily using the where command.
Powerful Pipelines and Commands
Standard Linux commands feel much more powerful here. Pipelines pass real data objects instead of raw text.
You do not need to use grep or awk. Simply select the columns you want to see.
Beginners will love the helpful error messages provided. The shell points exactly where your syntax failed.
Customizing your prompt is also a fun experience. You can use the built in configuration files.
Bash users are used to manipulating messy strings. Nushell eliminates the need for complex regular expressions.
Data Export and Performance
Every command output is a structured data object. You can export tables directly to JSON or CSV.
The shell is written entirely in the Rust language. This makes it very fast and memory efficient.
Native support for SQLite is built directly into Nushell. You can query databases without leaving your prompt.
Open Source MIT License
The project is fully open source for all users. It uses the permissive MIT License for its code.
This license allows you to use it very freely. Community members can contribute to the GitHub repository easily.
Advanced File Handling and Plugins
Opening a directory feels like opening a spreadsheet. Each file attribute has its own searchable column.
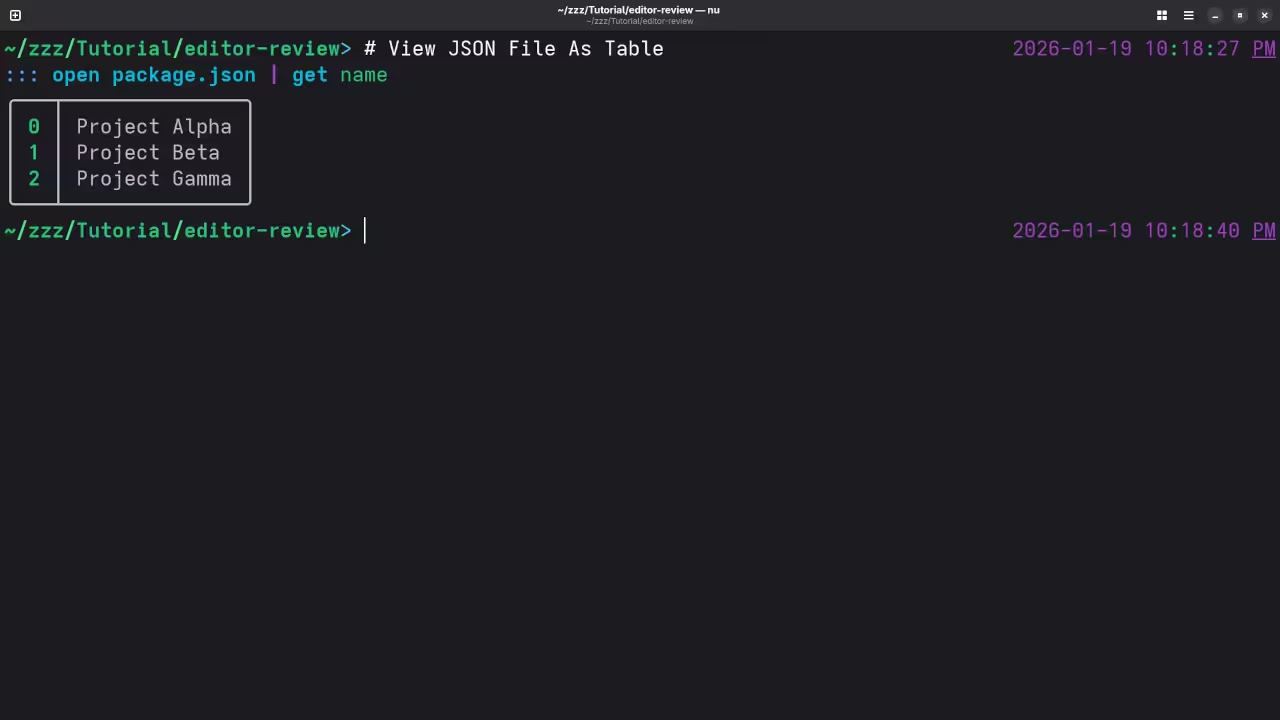
Use the get command to extract specific values. This is much easier than using cut or sed.
Pipelines in Nushell are extremely logical and clean. Data flows from one command to another smoothly.
The plugin system allows for massive community extensions. You can add new capabilities with minimal effort.
Try using the open command on a JSON file. Nushell converts the file into an interactive table instantly.
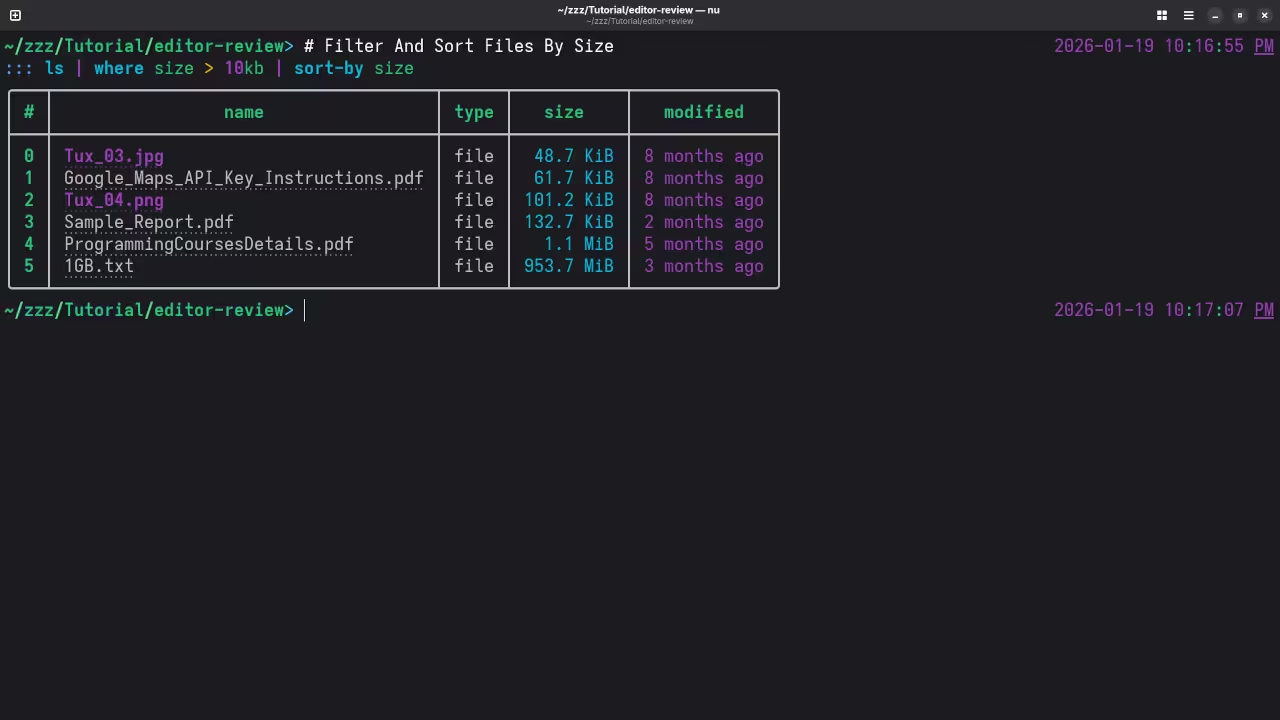
You can sort lists by size or date easily. Use the sort-by command to organize your file views.
Learning Nushell will change how you view the terminal. It brings modern data science tools to the shell.
This tool is perfect for developers working on Fedora. It bridges the gap between scripting and data.
📷 Screenshots
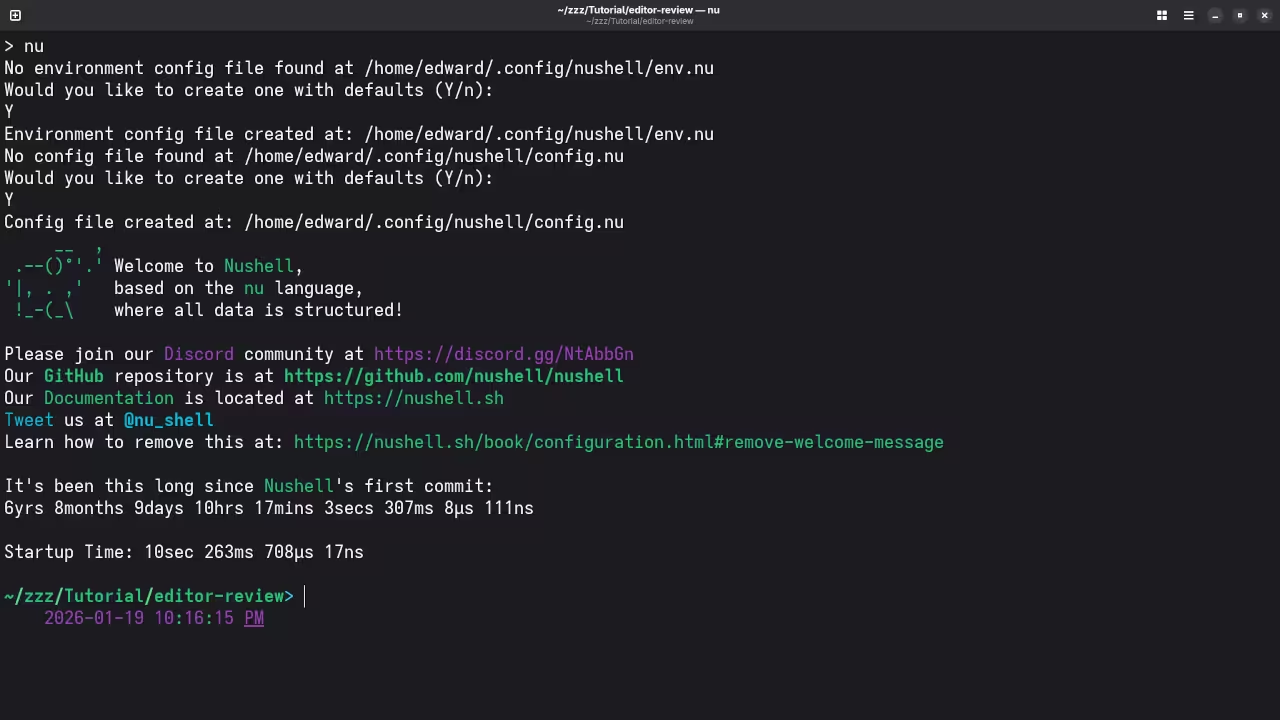
Command Line Displaying Nushell Initial ConfigurationCommand Line Displaying Nushell Filter Sort By SizeCommand Line Displaying Nushell Viewing JSON File As TableCommand Line Displaying Nushell Querying A REST APIGnome Terminal Preferences Custom Command Dialog
🎬 Live YouTube Screencast
Video Displaying The Installation And Use Of Nushell