
Introduction
Learn to build 3D charts with Python. Fedora Linux makes this process very smooth.
Getting Started on Fedora Linux
First install Blender on your Fedora system. Use the dnf command in your terminal.
Using the Blender Python API
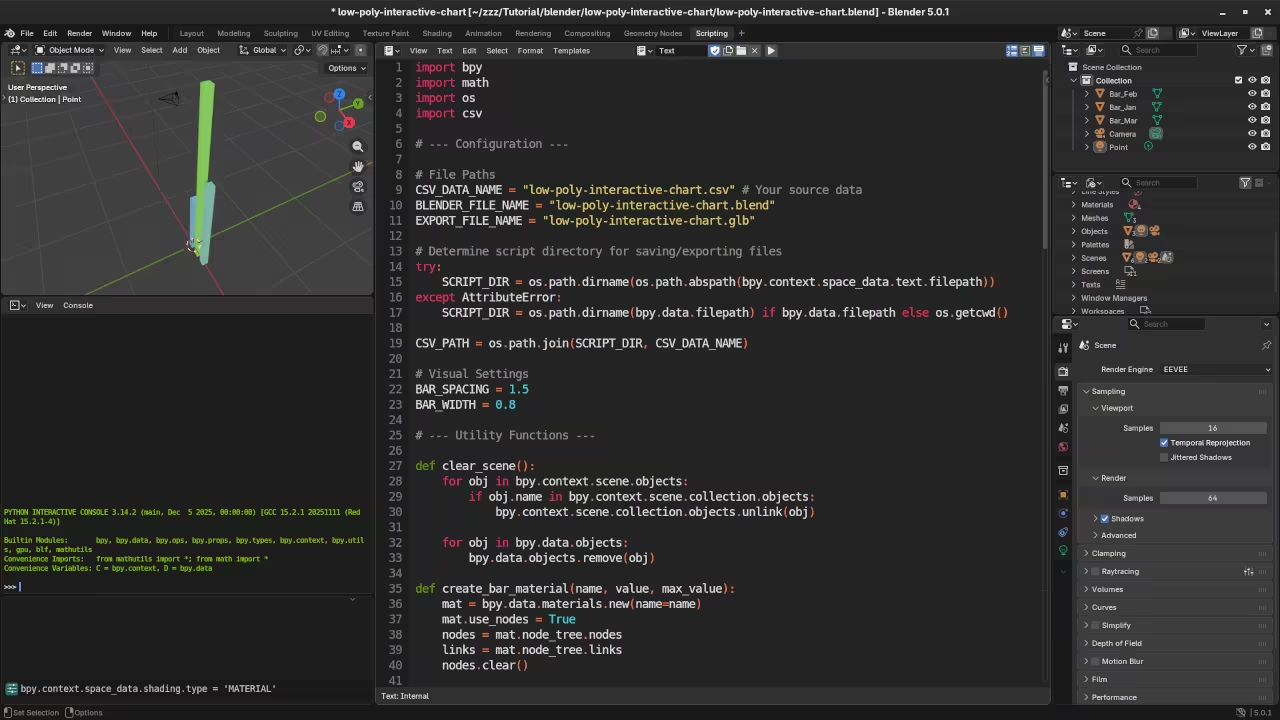
Blender features a powerful Python scripting environment. This API automates every 3D modeling step.
Create a CSV file for your chart data. Save it inside your main project folder.
import bpy
import csv
import os
# --- CONFIGURATION ---
CSV_FILE_PATH = "path/to/your/data.csv" # Update this!
EXPORT_PATH = "path/to/your/chart.glb"
GAP = 1.5 # Space between bars
def create_bar(name, value, index):
# Create a cube
bpy.ops.mesh.primitive_cube_add(size=1)
bar = bpy.context.active_object
bar.name = name
# Scale and position (Blender cubes are 2 units tall by default)
bar.scale = (0.5, 0.5, value / 2)
bar.location = (index * GAP, 0, value / 2)
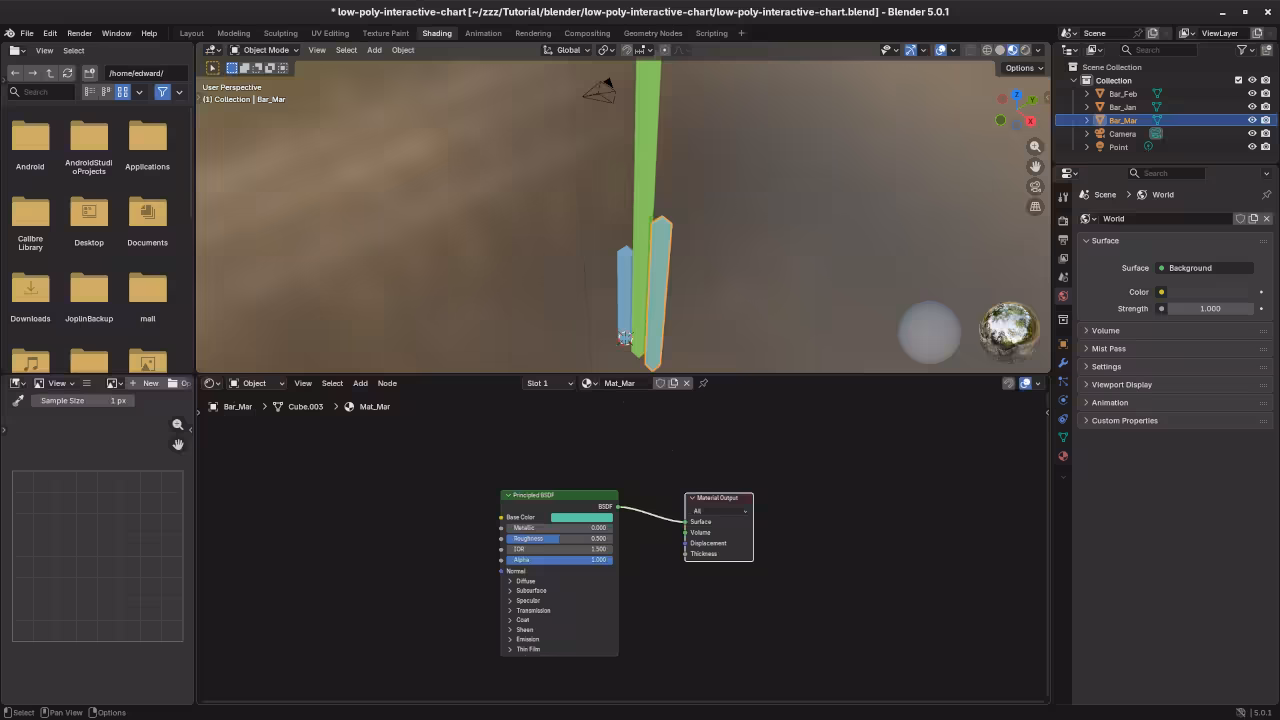
# Create Material
mat = bpy.data.materials.new(name=f"Mat_{name}")
mat.use_nodes = True
nodes = mat.node_tree.nodes
# Set color based on height (Simple Green to Red logic)
color_node = nodes.get("Principled BSDF")
color_node.inputs[0].default_value = (value/10, 0.1, 0.8, 1)
bar.data.materials.append(mat)
def generate_chart():
# Clear existing objects
bpy.ops.object.select_all(action='SELECT')
bpy.ops.object.delete()
with open(CSV_FILE_PATH, mode='r') as f:
reader = csv.DictReader(f)
for i, row in enumerate(reader):
label = row['Label']
val = float(row['Value'])
create_bar(label, val, i)
# Export to GLB for Web
bpy.ops.export_scene.gltf(filepath=EXPORT_PATH, export_format='GLB')
print(f"Chart exported to {EXPORT_PATH}")
if __name__ == "__main__":
generate_chart()
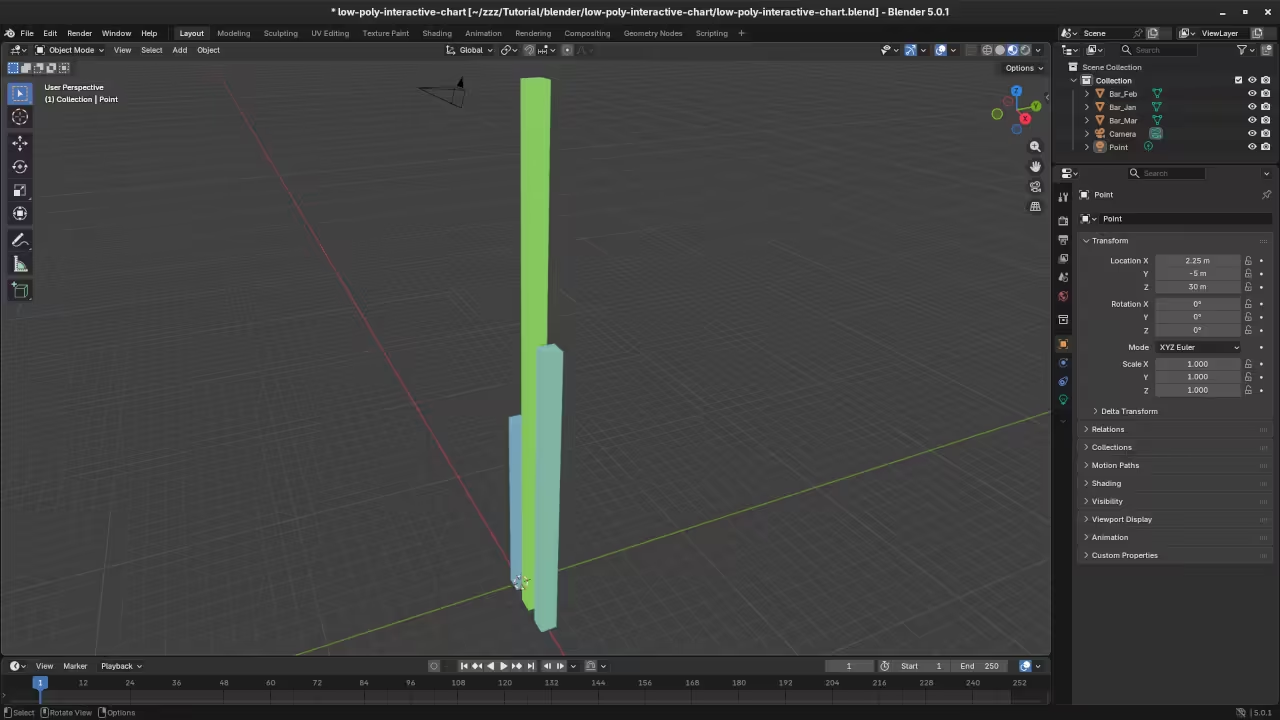
Data Processing and Mesh Generation
The script reads your specific data values. It creates a unique bar for each.
Height scales automatically based on your numbers. Materials change color to reflect different values.
<script type="importmap">
{
"imports": {
"three": "https://unpkg.com/three@0.160.0/build/three.module.js",
"three/addons/": "https://unpkg.com/three@0.160.0/examples/jsm/"
}
}
</script>
<script type="module">
import * as THREE from 'three';
import { OrbitControls } from 'three/addons/controls/OrbitControls.js';
import { GLTFLoader } from 'three/addons/loaders/GLTFLoader.js';
import { EXRLoader } from 'three/addons/loaders/EXRLoader.js';
let scene, camera, renderer, controls;
init();
function init() {
// 1. Scene & Camera
scene = new THREE.Scene();
camera = new THREE.PerspectiveCamera(75, window.innerWidth / window.innerHeight, 0.1, 1000);
camera.position.set(5, 5, 10);
// 2. Renderer Setup
renderer = new THREE.WebGLRenderer({ antialias: true });
renderer.setPixelRatio(window.devicePixelRatio);
renderer.setSize(window.innerWidth, window.innerHeight);
renderer.toneMapping = THREE.ReinhardToneMapping; // Better for HDR/EXR
renderer.toneMappingExposure = 1.0;
document.body.appendChild(renderer.domElement);
// 3. Orbit Controls
controls = new OrbitControls(camera, renderer.domElement);
controls.enableDamping = true;
// 4. Load EXR Environment Map
new EXRLoader()
.load('courtyard.exr', function (texture) {
texture.mapping = THREE.EquirectangularReflectionMapping;
scene.background = texture;
scene.environment = texture; // This provides the lighting
// 5. Load the Blender GLB Chart
const loader = new GLTFLoader();
loader.load('interactive_chart.glb', function (gltf) {
scene.add(gltf.scene);
// Center the model based on its bounding box
const box = new THREE.Box3().setFromObject(gltf.scene);
const center = box.getCenter(new THREE.Vector3());
gltf.scene.position.x += (gltf.scene.position.x - center.x);
animate();
}, undefined, function (error) {
console.error('Error loading GLB:', error);
});
});
window.addEventListener('resize', onWindowResize);
}
function onWindowResize() {
camera.aspect = window.innerWidth / window.innerHeight;
camera.updateProjectionMatrix();
renderer.setSize(window.innerWidth, window.innerHeight);
}
function animate() {
requestAnimationFrame(animate);
controls.update();
renderer.render(scene, camera);
}
</script>
Exporting for Web Deployment
Export the final scene to a GLB file. ThreeJS displays the 3D model online.
Add a courtyard EXR for natural lighting. This makes your web chart look realistic.
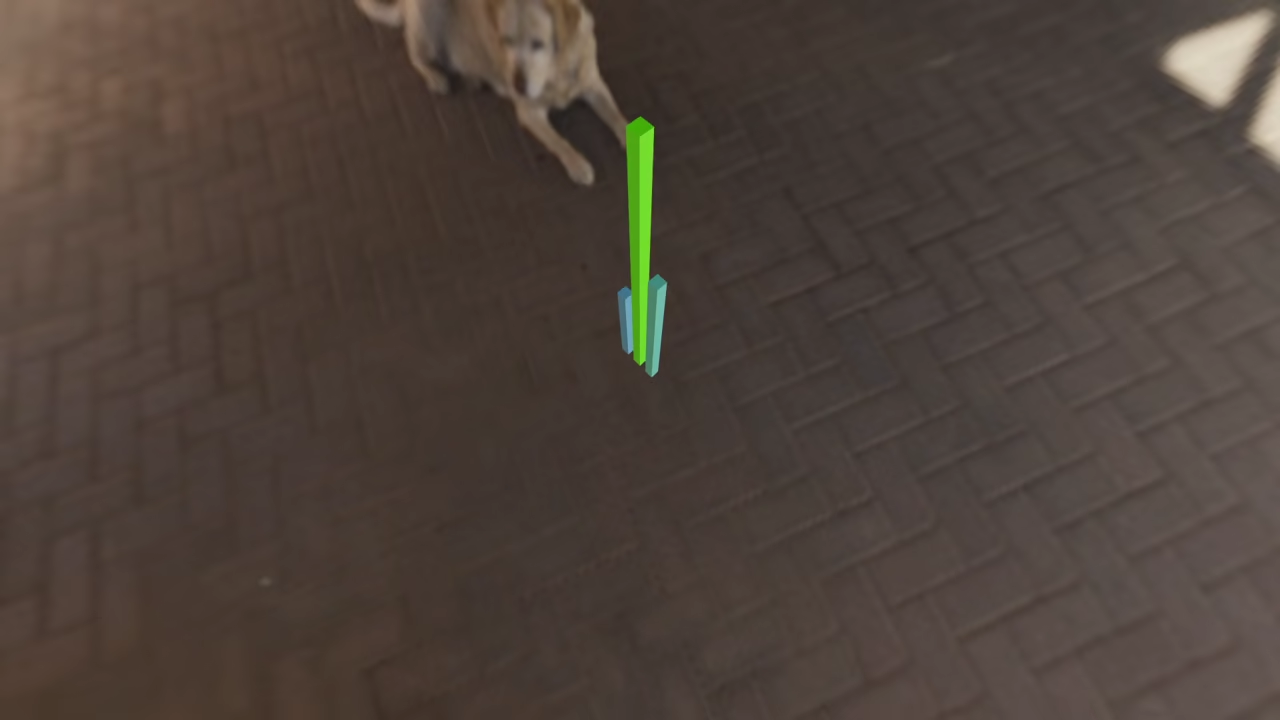
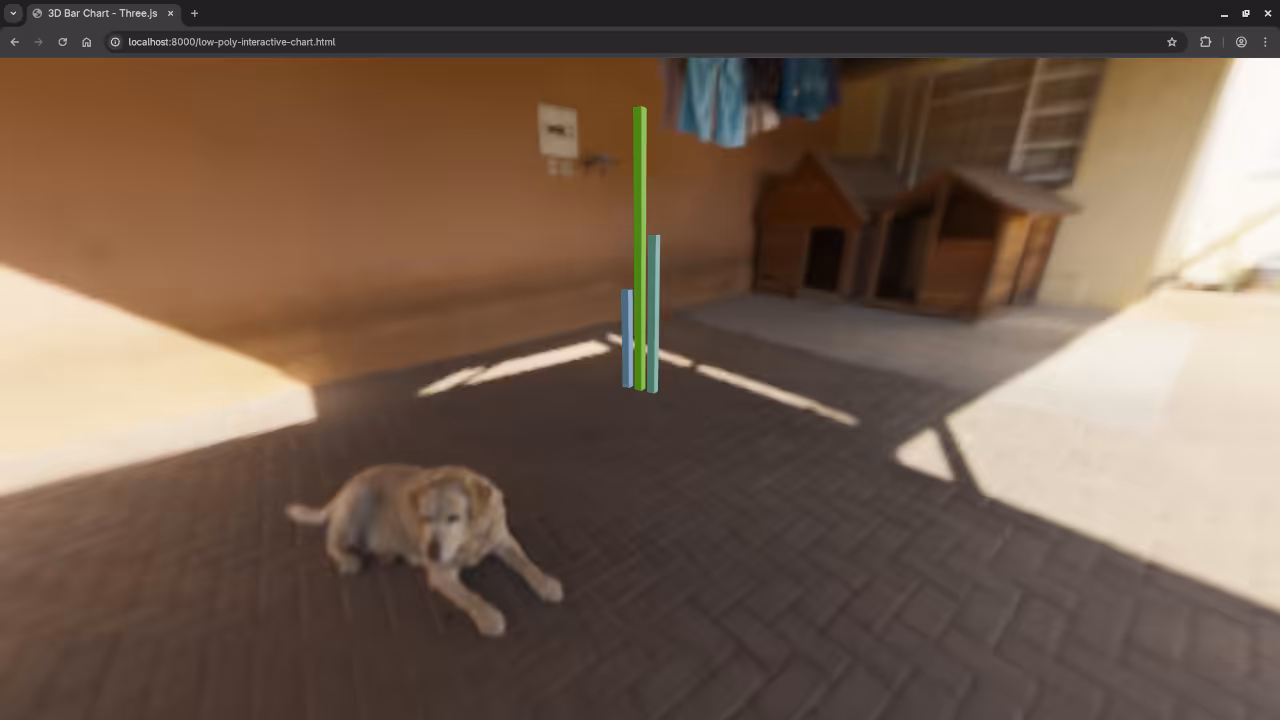
📸 Screenshots & Screencast
Take Your Skills Further
- Books: https://www.amazon.com/stores/Edward-Ojambo/author/B0D94QM76N
- Courses: https://ojamboshop.com/product-category/course
- Tutorials: https://ojambo.com/contact
- Consultations: https://ojamboservices.com/contact
🚀 Recommended Resources
Disclosure: Some of the links above are referral links. I may earn a commission if you make a purchase at no extra cost to you.