
Have you ever wanted to create a simple graphing tool using just HTML5 and JavaScript? In this tutorial, I’ll show you how to build a spreadsheet-style data input table that plots dynamic bar and line graphs using the <canvas> element — no external libraries required.
This project is perfect for JavaScript beginners, especially if you enjoy learning through hands-on examples.
🎯 What You’ll Learn
- How to use
<input type="number">in a spreadsheet-style table - Automatically add new rows when inputs are filled
- Draw bar and line graphs using the HTML5
<canvas> - Add interactivity with JavaScript
- Toggle between graph types using a dropdown
📑 Project Code Overview
We’ll create:
- A simple table with two columns for X and Y values
- Auto-expanding rows when both X and Y are filled
- A dropdown to choose between Line or Bar graph
- Canvas rendering logic to draw and update the graph
💻 Technologies Used
- HTML5 for structure and canvas
- CSS3 for minimal styling
- Vanilla JavaScript for dynamic interaction
<!DOCTYPE html>
<html lang="en">
<head>
<meta charset="UTF-8" />
<title>Line/Bar Graph Plotter</title>
<style>
body {
font-family: sans-serif;
padding: 20px;
background: #f0f0f0;
}
table {
width: 300px;
margin-bottom: 10px;
border-collapse: collapse;
}
th, td {
padding: 6px;
border: 1px solid #ccc;
text-align: center;
}
input[type="number"] {
width: 80px;
padding: 4px;
text-align: right;
}
select, button {
padding: 8px 12px;
margin: 10px 0;
font-size: 14px;
}
canvas {
border: 1px solid #333;
background: #fff;
display: block;
margin-top: 20px;
}
</style>
</head>
<body>
<h2>Spreadsheet Graph Plotter</h2>
<label>Choose Graph Type:</label>
<select id="graphType">
<option value="line">Line Graph</option>
<option value="bar">Bar Graph</option>
</select>
<table id="dataTable">
<thead>
<tr><th>X</th><th>Y</th></tr>
</thead>
<tbody>
<tr>
<td><input type="number" step="any" /></td>
<td><input type="number" step="any" /></td>
</tr>
</tbody>
</table>
<button onclick="plotGraph()">Plot Graph</button>
<canvas id="graphCanvas" width="600" height="400"></canvas>
<script>
const table = document.getElementById('dataTable').getElementsByTagName('tbody')[0];
// Add new row if last one is filled
table.addEventListener('input', () => {
const rows = table.rows;
const lastRow = rows[rows.length - 1];
const xInput = lastRow.cells[0].querySelector('input');
const yInput = lastRow.cells[1].querySelector('input');
if (xInput.value && yInput.value) {
addRow();
}
});
function addRow() {
const newRow = table.insertRow();
const xCell = newRow.insertCell(0);
const yCell = newRow.insertCell(1);
const xInput = document.createElement('input');
xInput.type = 'number';
xInput.step = 'any';
const yInput = document.createElement('input');
yInput.type = 'number';
yInput.step = 'any';
xCell.appendChild(xInput);
yCell.appendChild(yInput);
}
function plotGraph() {
const graphType = document.getElementById("graphType").value;
const canvas = document.getElementById("graphCanvas");
const ctx = canvas.getContext("2d");
ctx.clearRect(0, 0, canvas.width, canvas.height);
let points = [];
const rows = table.rows;
for (let i = 0; i < rows.length; i++) {
const x = parseFloat(rows[i].cells[0].querySelector('input').value);
const y = parseFloat(rows[i].cells[1].querySelector('input').value);
if (!isNaN(x) && !isNaN(y)) {
points.push({ x, y });
}
}
if (points.length < 2) {
alert("Please enter at least two valid data points.");
return;
}
if (graphType === 'line') {
points.sort((a, b) => a.x - b.x);
}
const padding = 40;
const graphWidth = canvas.width - 2 * padding;
const graphHeight = canvas.height - 2 * padding;
const xVals = points.map(p => p.x);
const yVals = points.map(p => p.y);
const xMin = Math.min(...xVals);
const xMax = Math.max(...xVals);
const yMin = Math.min(0, ...yVals);
const yMax = Math.max(...yVals);
const xScale = graphWidth / (xMax - xMin || 1);
const yScale = graphHeight / (yMax - yMin || 1);
// Axes
ctx.strokeStyle = "#999";
ctx.lineWidth = 1;
ctx.beginPath();
ctx.moveTo(padding, canvas.height - padding);
ctx.lineTo(canvas.width - padding, canvas.height - padding); // X-axis
ctx.moveTo(padding, padding);
ctx.lineTo(padding, canvas.height - padding); // Y-axis
ctx.stroke();
if (graphType === 'line') {
// ✅ Draw a single path through all sorted points
ctx.strokeStyle = "#007acc";
ctx.lineWidth = 2;
ctx.beginPath();
points.forEach((point, i) => {
const xCoord = padding + (point.x - xMin) * xScale;
const yCoord = canvas.height - padding - (point.y - yMin) * yScale;
if (i === 0) {
ctx.moveTo(xCoord, yCoord);
} else {
ctx.lineTo(xCoord, yCoord);
}
});
ctx.stroke(); // ⬅️ Only stroke once, after path is fully defined
// ✅ Draw data points on top
points.forEach(point => {
const xCoord = padding + (point.x - xMin) * xScale;
const yCoord = canvas.height - padding - (point.y - yMin) * yScale;
ctx.fillStyle = "#ff3333";
ctx.beginPath();
ctx.arc(xCoord, yCoord, 4, 0, 2 * Math.PI);
ctx.fill();
});
}
if (graphType === 'bar') {
// Draw bars centered on each x
const barWidth = Math.min(40, graphWidth / xVals.length - 10);
points.forEach((point) => {
const xCoord = padding + (point.x - xMin) * xScale - barWidth / 2;
const yCoord = canvas.height - padding - (point.y - yMin) * yScale;
const barHeight = (point.y - yMin) * yScale;
ctx.fillStyle = "#28a745";
ctx.fillRect(xCoord, yCoord, barWidth, barHeight);
});
}
}
</script>
</body>
</html>
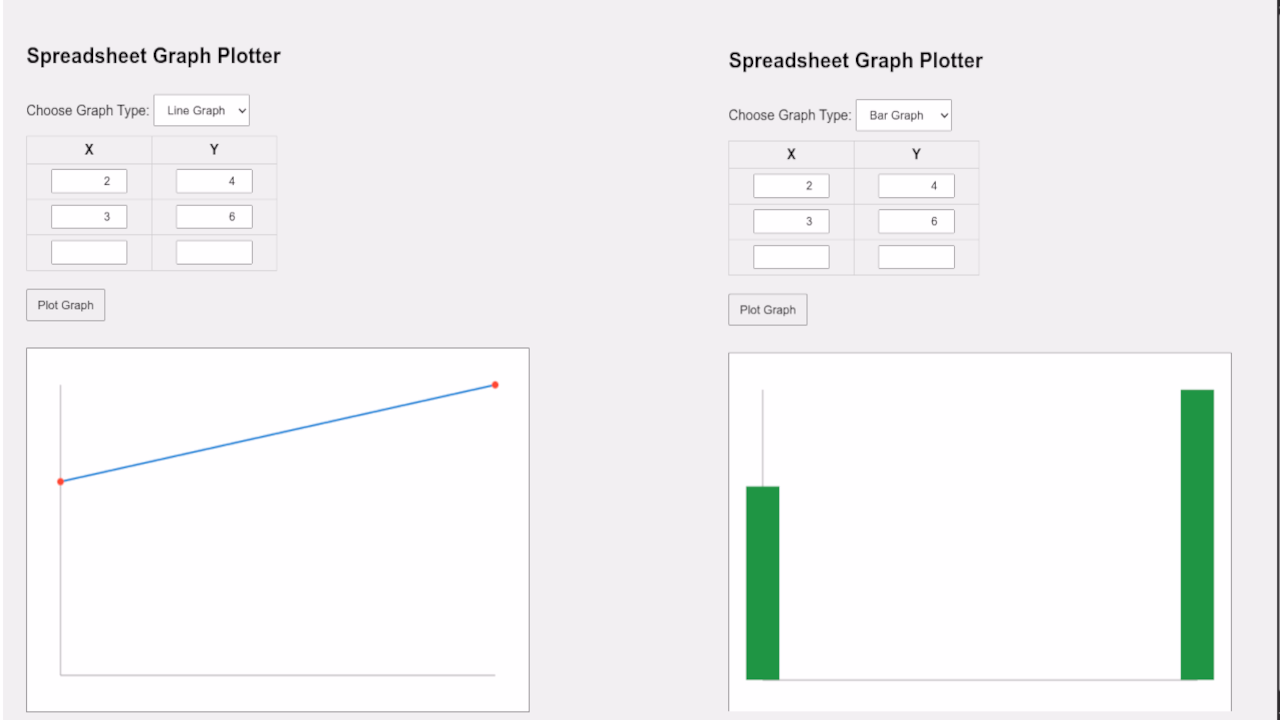
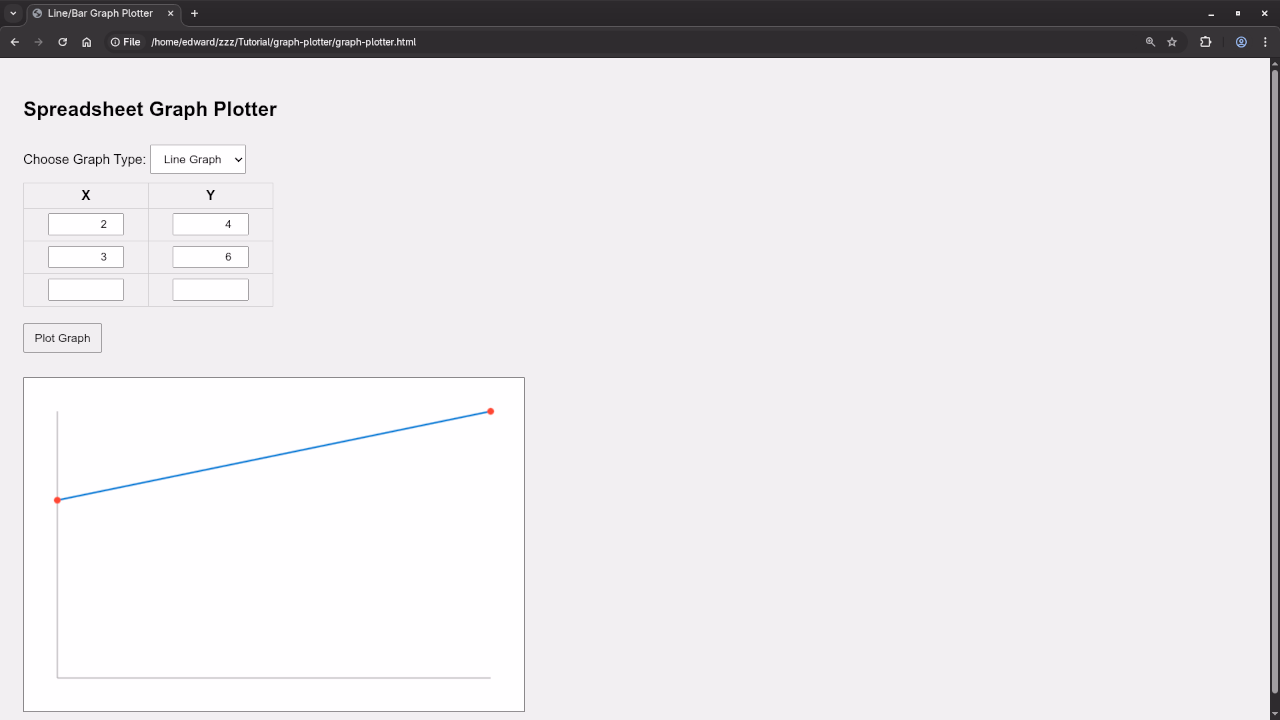
Interactive Demo
Here’s a live example of the Spreadsheet Graph in action:

📚 Want to Learn JavaScript More Deeply?
Check out my beginner-friendly book:
📖 Learning JavaScript – A Beginner’s Guide
Whether you’re starting fresh or revisiting JavaScript, this book is a solid companion.
Also, explore my full course here:
🎓 Learning JavaScript – Online Course
👨🎓 Need Help or 1-on-1 Tutoring?
I’m available for personalized programming tutorials — including HTML5, CSS, JavaScript, and more.
📧 Contact me here to book a session.
🔁 What’s Next?
In future tutorials, I’ll cover:
- Adding axis labels and gridlines
- Exporting graphs as images
- Saving input data to local storage or files
💬 Questions?
Have any questions or feedback? Leave a comment below or reach out through the contact form.
Happy coding!
🚀 Recommended Resources
Disclosure: Some of the links above are referral links. I may earn a commission if you make a purchase at no extra cost to you.