Tag: data visualization
-
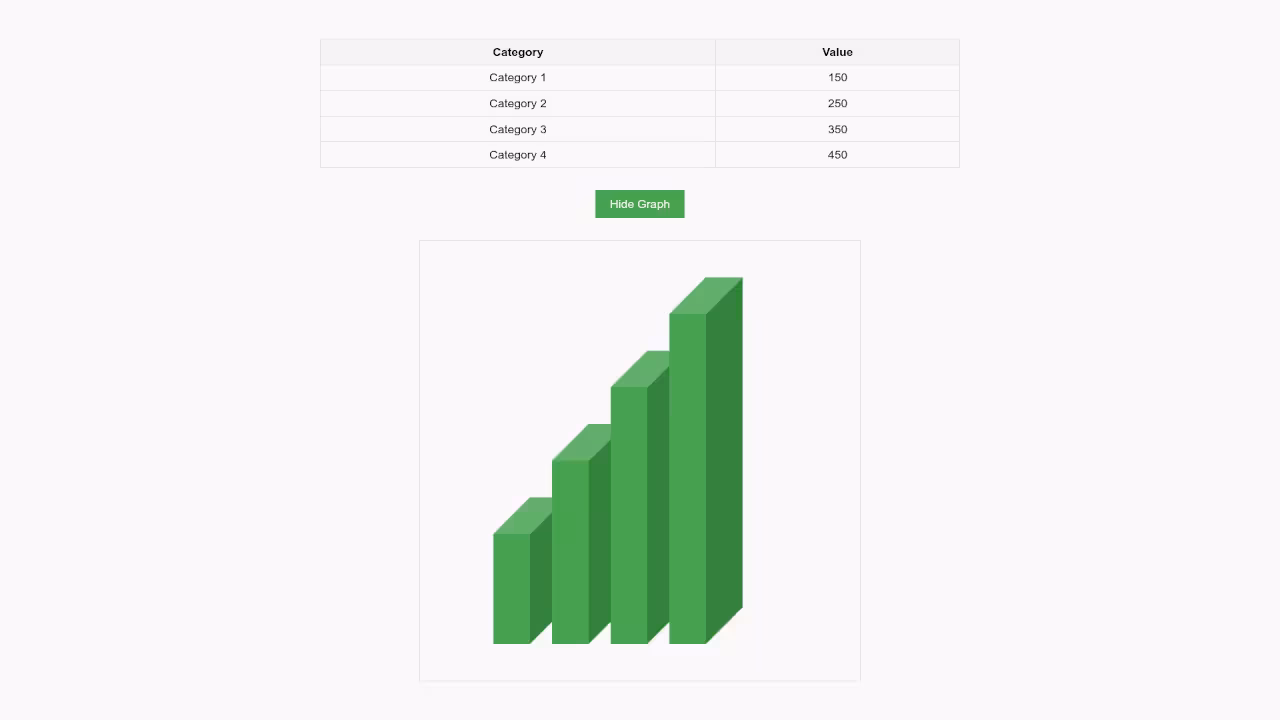
Build An HTML5 3D Bar Graph
How to Create Stunning HTML5 3D Bar Graphs with JavaScript Introduction Creating 3D bar graphs can add a touch of interactivity and professionalism to your web projects.
Written by
-
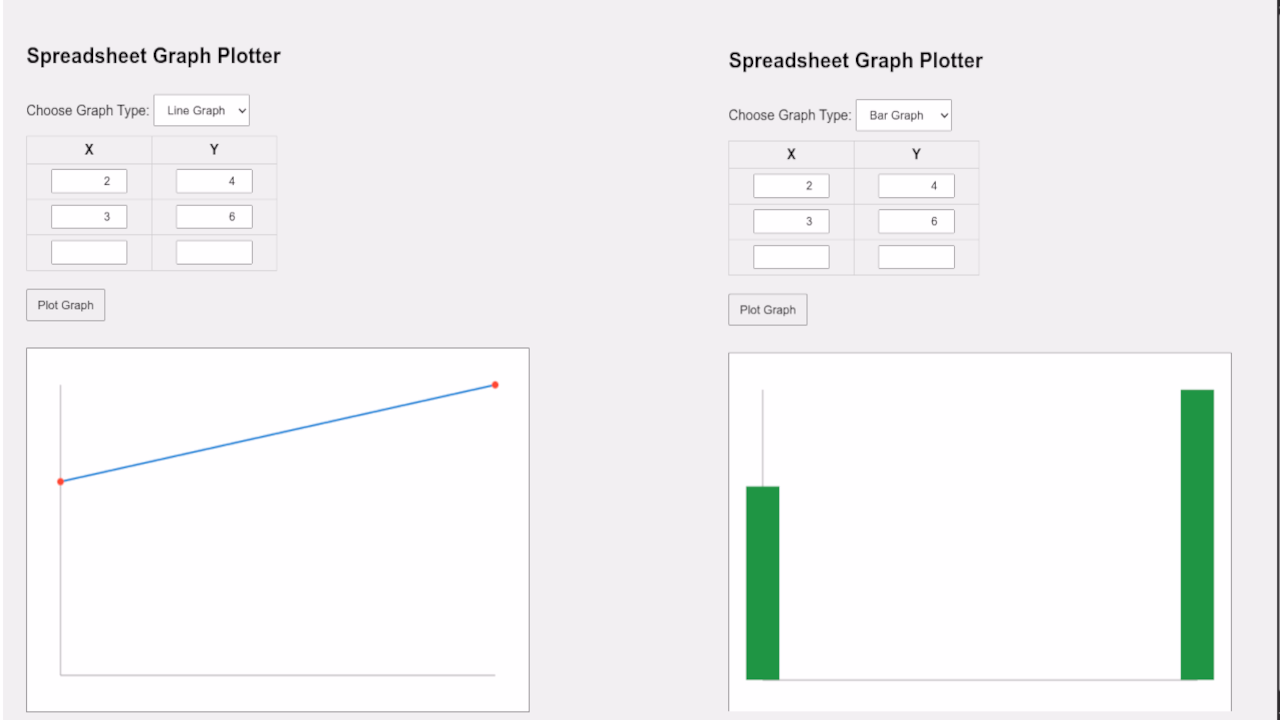
Build an HTML5 Spreadsheet-Like Graph Plotter with JavaScript
Have you ever wanted to create a simple graphing tool using just HTML5 and JavaScript?
Written by