
How to Create Stunning HTML5 3D Bar Graphs with JavaScript
Introduction
Creating 3D bar graphs can add a touch of interactivity and professionalism to your web projects. In this beginner friendly tutorial, we will walk through how to build a 3D bar graph using HTML5 and JavaScript. This approach leverages the canvas element, and with a bit of styling, you can bring your data to life in 3D. Lets get started!
Step 1: Setting Up the HTML and Canvas
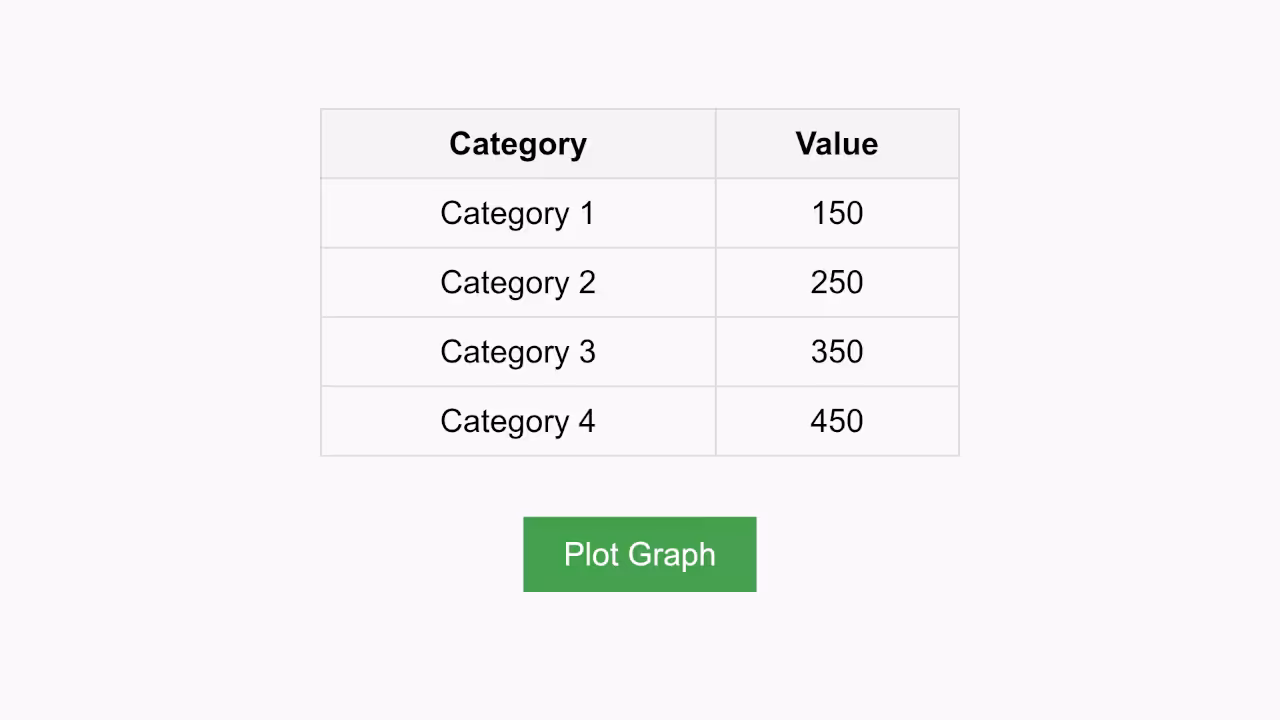
Before we jump into the code, it is important to understand the basic structure. The graph will be drawn on an HTML5 <canvas> element, and we will fetch data directly from an HTML table.
<table id="data-table">
<thead>
<tr>
<th>Category</th>
<th>Value</th>
</tr>
</thead>
<tbody>
<tr>
<td>Category 1</td>
<td>150</td>
</tr>
<tr>
<td>Category 2</td>
<td>250</td>
</tr>
<tr>
<td>Category 3</td>
<td>350</td>
</tr>
<tr>
<td>Category 4</td>
<td>450</td>
</tr>
</tbody>
</table>
<canvas id="barGraph" width="600" height="400"></canvas>
In this setup, we have a simple table with categories and values, and the canvas element where the graph will be drawn.
Step 2: JavaScript for Drawing the 3D Bar Graph
We will use JavaScript to draw the graph on the canvas. Here is the code that makes this possible:
// JavaScript code for generating the 3D bar graph
const canvas = document.getElementById('barGraph');
const ctx = canvas.getContext('2d');
const data = []; // Data for the graph
const tableRows = document.querySelectorAll('#data-table tbody tr');
// Fetch data from the table
tableRows.forEach(row => {
const category = row.cells[0].innerText;
const value = parseInt(row.cells[1].innerText);
data.push({ category, value });
});
// Bar properties and depth factor
const barWidth = 50;
const gap = 30;
const depthFactor = 0.3; // Controls depth of the bars
// Function to draw a 3D bar
function draw3DBar(x, y, width, height, depth) {
ctx.fillStyle = '#4CAF50';
ctx.beginPath();
ctx.moveTo(x, y); // Bottom-left corner
ctx.lineTo(x + width, y); // Bottom-right corner
ctx.lineTo(x + width, y - height); // Top-right corner
ctx.lineTo(x, y - height); // Top-left corner
ctx.closePath();
ctx.fill();
ctx.fillStyle = '#388E3C'; // Right face
ctx.beginPath();
ctx.moveTo(x + width, y);
ctx.lineTo(x + width + depth, y - depth);
ctx.lineTo(x + width + depth, y - height - depth);
ctx.lineTo(x + width, y - height);
ctx.closePath();
ctx.fill();
ctx.fillStyle = '#66BB6A'; // Top face
ctx.beginPath();
ctx.moveTo(x, y - height);
ctx.lineTo(x + width, y - height);
ctx.lineTo(x + width + depth, y - height - depth);
ctx.lineTo(x + depth, y - height - depth);
ctx.closePath();
ctx.fill();
}
// Function to draw the graph
function drawGraph() {
ctx.clearRect(0, 0, canvas.width, canvas.height); // Clear canvas
let x = 100; // Starting x-position
const baseY = canvas.height - 50; // Bottom of canvas
data.forEach(item => {
const barHeight = item.value;
const depth = barHeight * depthFactor; // Adjust depth
draw3DBar(x, baseY, barWidth, barHeight, depth);
x += barWidth + gap; // Move x for next bar
});
}
// Draw the graph
drawGraph();
In this code, we define a function draw3DBar that draws the 3D effect on each bar. We also loop through the table data to create bars of varying heights, and use depthFactor to control the depth.
Step 3: Visualizing the 3D Effect
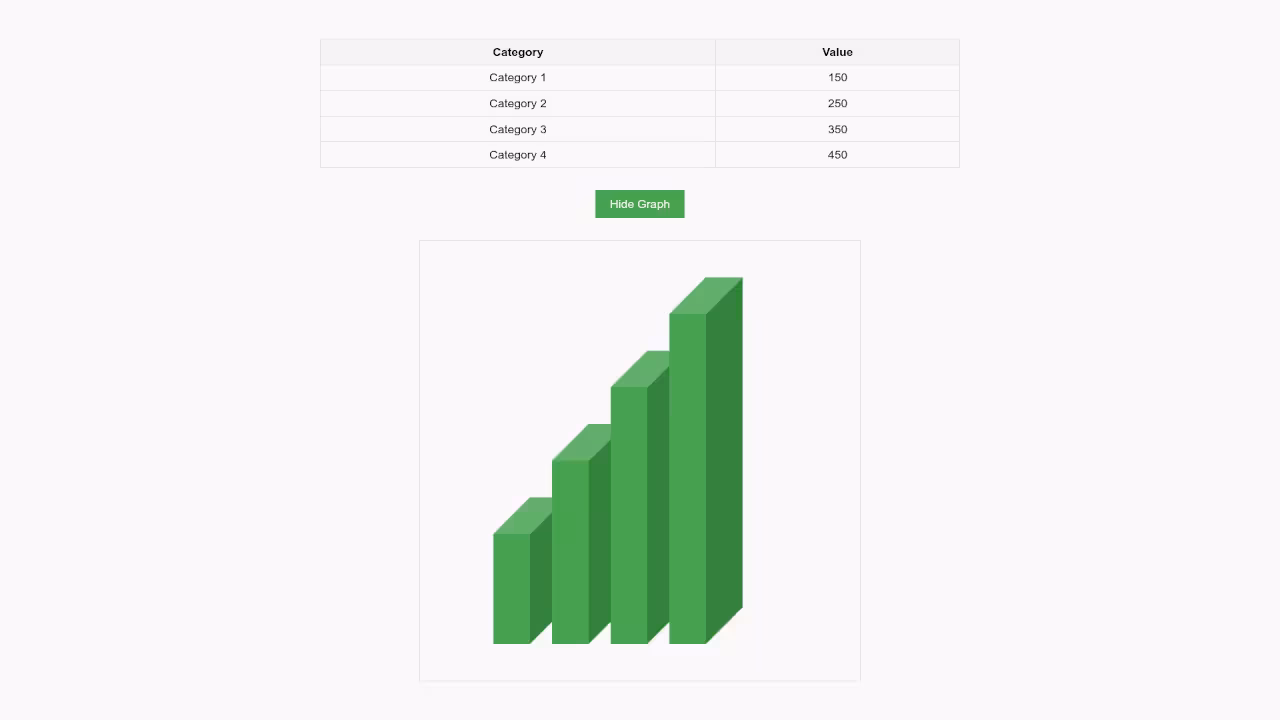
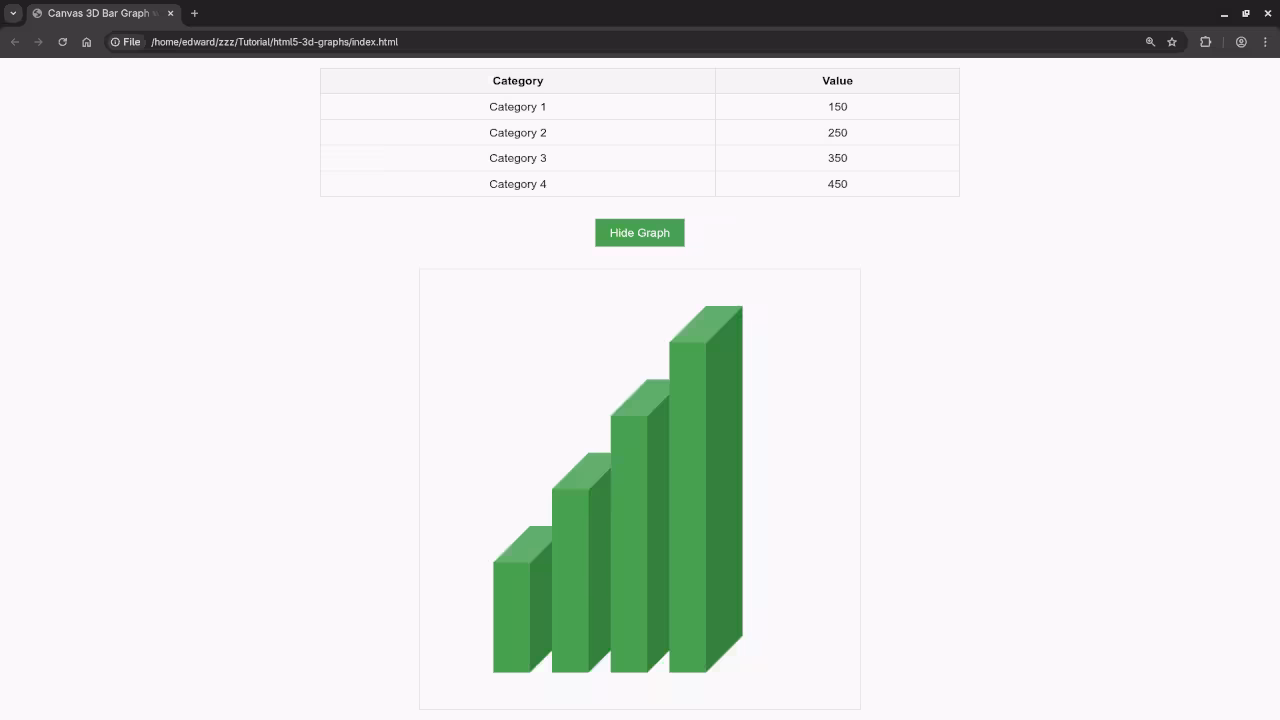
This code will generate a simple 3D effect by using depth for each bar. The bars appear to pop out of the canvas, giving them a three dimensional look. You can experiment with the depthFactor to adjust how deep the bars appear.
Consolidated Demo
Screenshot
Live Screencast
Additional Resources
If you want to deepen your knowledge of JavaScript, I have written a book titled Learning JavaScript that covers the fundamentals and will help you build a solid foundation in programming. You can grab a copy here: Learning JavaScript on Amazon.
Additionally, I have created an online course called Learning JavaScript, where I take you through JavaScript from beginner to intermediate level with hands on exercises and examples. You can check it out here: Learning JavaScript Course.
Lastly, if you need one on one programming tutorials, I am available to help you with JavaScript or any other programming topic. Feel free to reach out to me: Contact for One on One Tutorials.
Conclusion
Creating 3D bar graphs with HTML5 and JavaScript is a fun and interactive way to visualize data on the web. By using the canvas element and manipulating it with JavaScript, you can create dynamic, engaging visualizations that look great on any website.
🚀 Recommended Resources
Disclosure: Some of the links above are referral links. I may earn a commission if you make a purchase at no extra cost to you.