

Real Time Monitoring Secrets for Fedora 44
The modern server admin faces a nightmare of fragmented monitoring tools. Most tools either eat all your RAM or require dangerous root access.
This setup solves that by combining rootless Podman with Netdata. You can finally see every single packet moving through your network.
The real time resolution is far better than any traditional monitoring tool. It turns a blind system into a fully transparent operation.
Disclaimer: I may earn a commission from purchases made through these links at no extra cost to you.


The Experience of Total Visibility
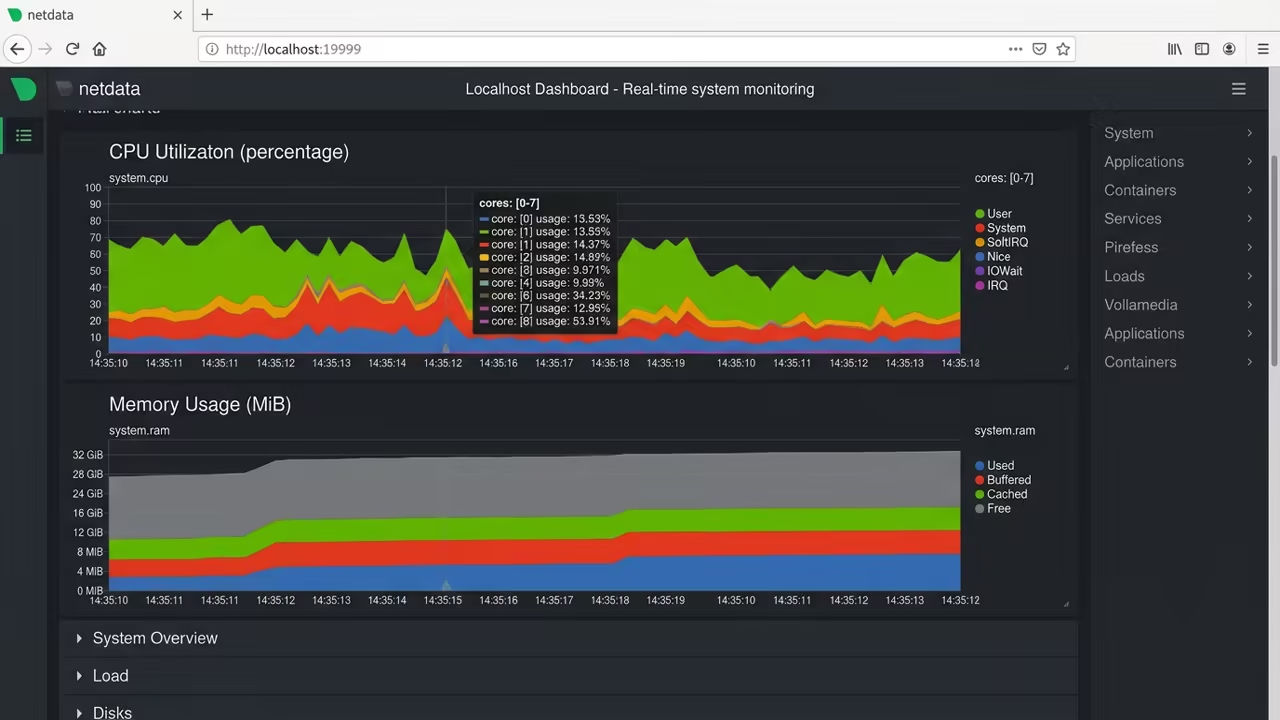
The moment the first real time graph appears on your dashboard is magic. You see every CPU spike and memory leak in absolute precision.
It feels like having an X ray machine for your entire hardware stack. You will experience a sudden surge in confidence regarding your system stability.
No more guessing why the server slowed down at three in the morning. Every metric is captured with a one second granularity.
Deploying Podman Desktop for Container Management
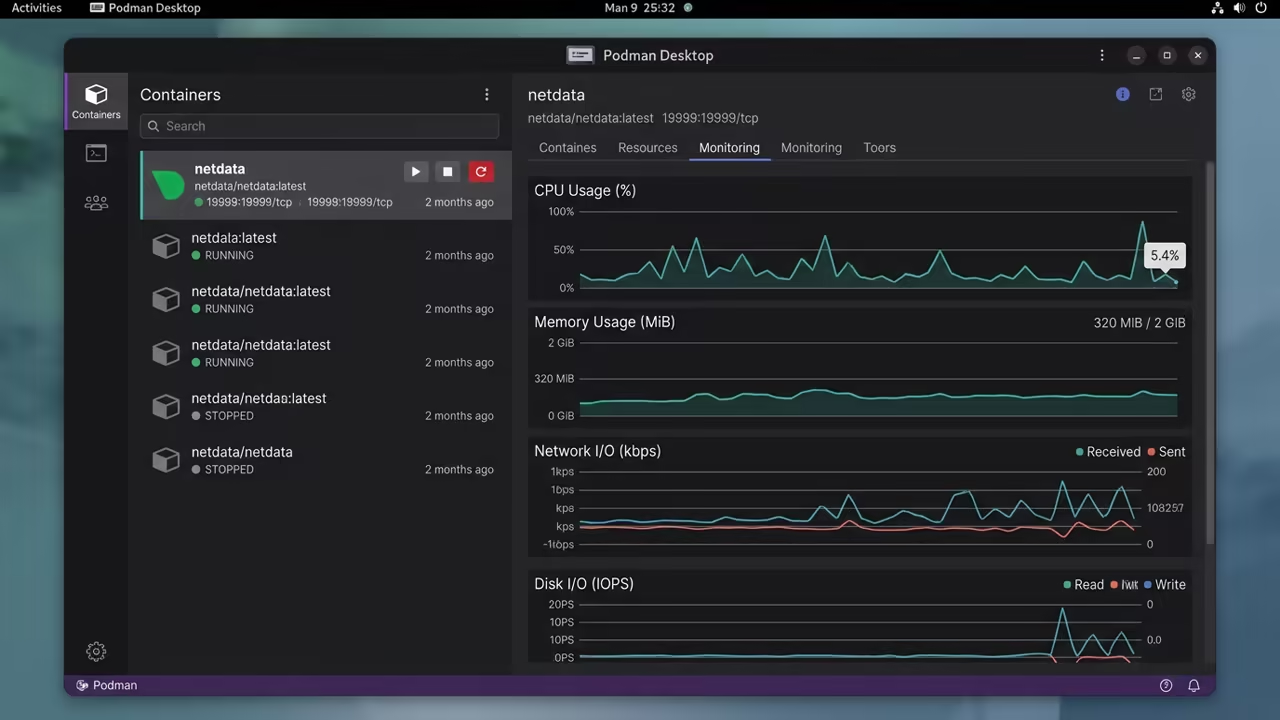
Start by installing Podman Desktop on your Fedora 44 workstation. This tool provides a visual layer over the powerful Podman engine.
It makes managing complex container lifecycles a simple point and click task. First you must ensure the Podman socket is active for the GUI.
Open your terminal and execute the following command to enable the service.
systemctl --user enable --now podman.socket
Launching the Netdata Monitoring Stack
Next you will pull the official Netdata image from the container registry. Podman Desktop allows you to do this via the images tab.
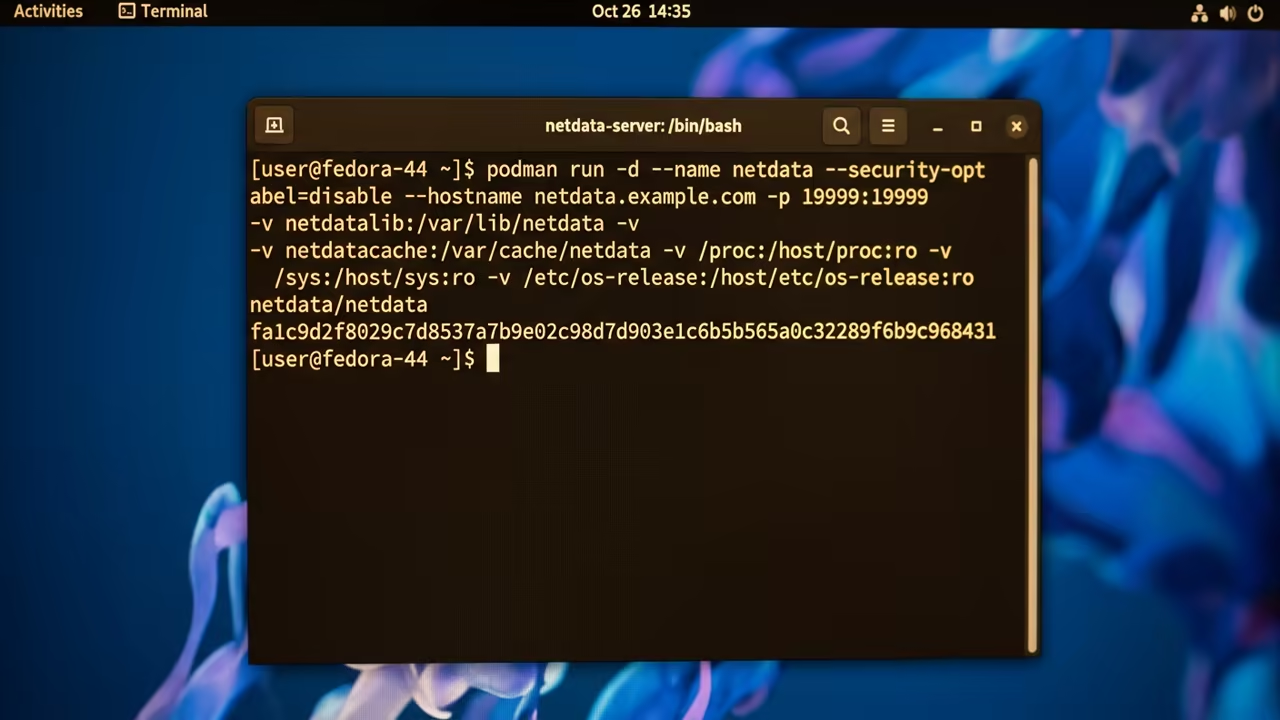
Alternatively you can use the terminal for a faster deployment process. Run the Netdata container with specific volume mounts for host access.
You need the proc and sys directories to monitor the hardware.
podman run -d --name=netdata -p 19999:19999 -v /proc:/host/proc:ro -v /sys:/host/sys:ro --security-opt label=disable netdata/netdata
The Rootless Security Secret for Fedora 44
The secret to making this work on Fedora 44 is the security option. You must use the label=disable flag to bypass strict SELinux restrictions.
Without this flag the container cannot read the critical host metrics. This insider detail ensures your monitoring is comprehensive without compromising the rootless model.
Most guides forget that Fedora requires these specific security labels for host mounts. This one line of code prevents hours of debugging permission errors.
Comparative Performance Analysis
Comparing these tools shows why this specific stack is the superior choice. Podman offers security while the desktop app provides the necessary visibility.
| Parameter | Podman | Docker | Podman Desktop |
|---|---|---|---|
| Rootless | Native | Limited | Management Layer |
| Daemon | None | Heavy | Visual Interface |
| Security | High | Moderate | High |
| Setup | Fast | Slow | Instant |
This architectural approach connects to our previous deep dives on rootless environments. It represents a major breakthrough in how we handle system telemetry.
You are now moving toward a fully sovereign tech stack. The efficiency of this setup reduces overhead on your Ryzen 5 5600GT.
You save precious RAM for your actual workloads and creative projects. The system remains lean and responsive during peak loads.
Master the Sovereign Tech Stack
If you want to fully escape the cloud trap you need a strategic blueprint. This is exactly why I wrote the book The Sovereign Business.
It provides the complete architectural framework for running Podman containers as a business asset. Stop relying on rented infrastructure and start owning your data.
Grab your copy of The Sovereign Business today to secure your digital independence.
Get The Sovereign Business on Amazon
Professional Implementation Services
Deploying a sovereign stack at scale requires precision engineering. My freelance business provides the high tier automation and server security you need.
From AI implementation to complex server management I ensure your infrastructure is bulletproof. Contact me for a professional consultation to scale your systems.
Consultations: https://ojamboservices.com/contact
Learning and Support
Reach out for personalized technical help to optimize your monitoring stack. Dive deeper with our online tutorials to master the art of self hosting.
Online Tutorials & Technical Help: https://ojambo.com/contact
Professional Resource Stack
For those seeking high tier implementation guidebooks check the Amazon Author Page. Explore essential technical blueprints for home labs.
Books: https://www.amazon.com/stores/Edward-Ojambo/author/B0D94QM76N
Blueprints: https://ojamboshop.com
🚀 Recommended Resources
Disclosure: Some of the links above are referral links. I may earn a commission if you make a purchase at no extra cost to you.
Leave a Reply